Welfare: Who’s on It, Who’s Not?
F. Roger Devlin and Henry Wolff, American Renaissance, October 14, 2015
The Center for Immigration Studies (CIS) has published a new report called “Welfare Use by Immigrant and Native Households.” The report’s principle finding is that fully 51 percent of immigrant households receive some form of welfare, compared to an already worrisomely high 30 percent of American native households. The new study is based on the most accurate data available, the Census Bureau’s Survey of Income and Program Participation (SIPP). It also reports stark racial differences in the use of welfare programs.
Previous studies of welfare use have been based on the less accurate but more easily accessible data available from the Current Population Survey; this led to less alarming figures of 39 percent of immigrant households using welfare and 24 percent of native households. CIS’s Steve Camarota took the trouble to work with the SIPP data, which cover a larger number of welfare programs. His results have been independently verified by Decision Demographics, a company specializing in analysis of Census Bureau data.
The programs covered in Mr. Camarota’s study include Supplemental Security Income, Temporary Assistance for Needy Families (what used to be most commonly called “welfare”), the Women, Infants and Children food program, the Supplemental Nutrition Assistance Program (“food stamps”), free and subsidized school lunches, Medicaid, and public housing and rent subsidies.
Needless to say, the percentage of immigrants using some form of welfare varies enormously according to the part of the world from which they come. Rates are highest for households from Central America and Mexico (73 percent), the Caribbean (51 percent), and Africa (48 percent). Those from East Asia (32 percent), Europe (26 percent), and South Asia (17 percent) have the lowest rates.
An appendix to the report includes some startling information on welfare use by race and ethnicity. In 2012, the most recent year for which figures are available, the percentages of each group that used at least one welfare program were as follow:
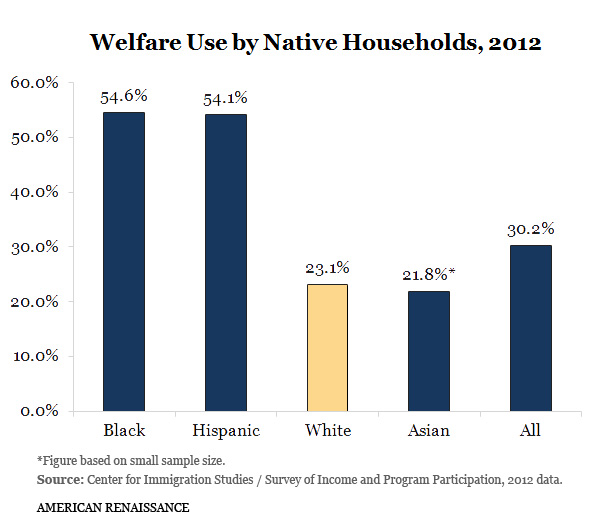
A majority of native black and Hispanic households are on some form of means-tested welfare, compared to just 23 percent of native white households.
A disproportionate share of welfare is directed to households with children. For this group, the corresponding numbers for 2012 are even higher:
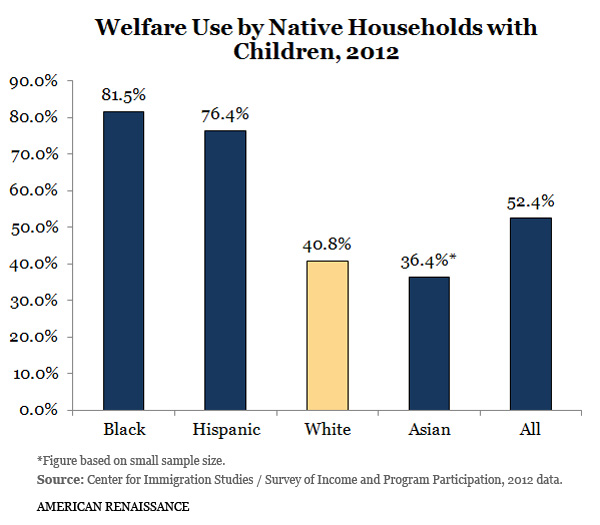
A striking 82 percent of black households with children receive welfare–double the white rate. Hispanic families are not far behind blacks.
Of course, different welfare programs are used at different rates. What follow are sets of charts showing, first, the welfare rates for all US households, and second, welfare rates only for households with children. The percentages for Hispanic and black immigrants include both legal and illegal immigrants.
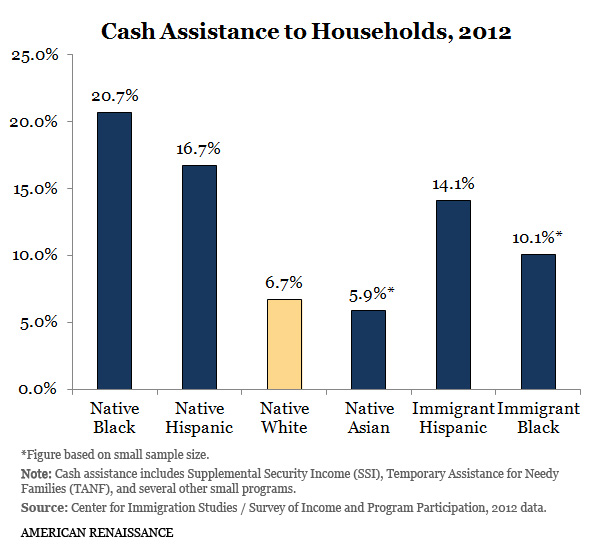
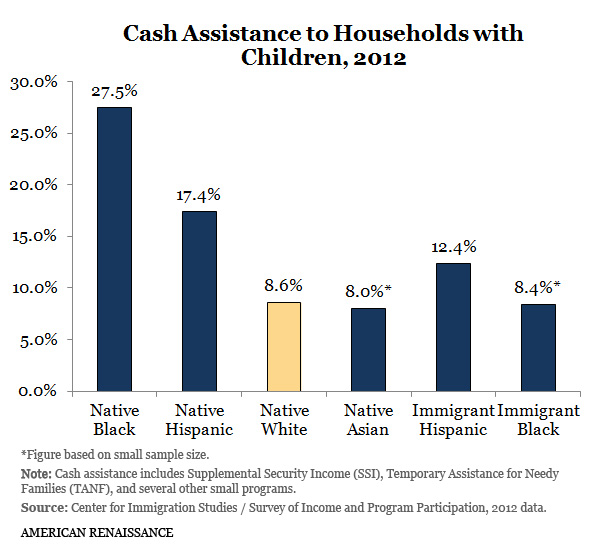
Among natives, blacks receive cash handouts at more than three times the white rate; Hispanics at more than twice the white rate. Rates for black and Hispanic immigrants are relatively lower due to often-ignored restrictions on immigrant use of these programs.
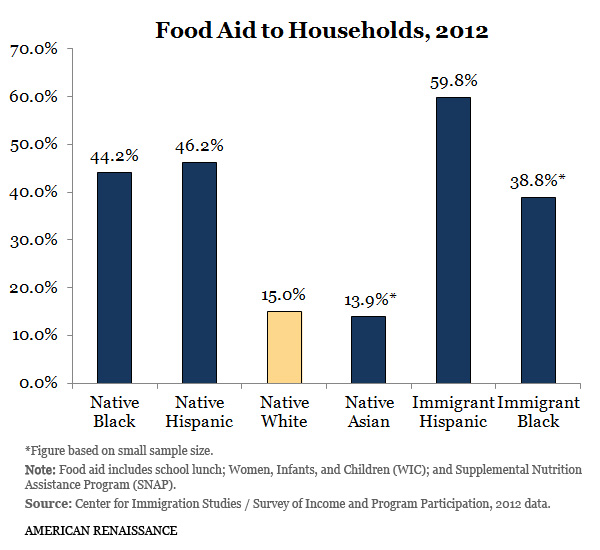
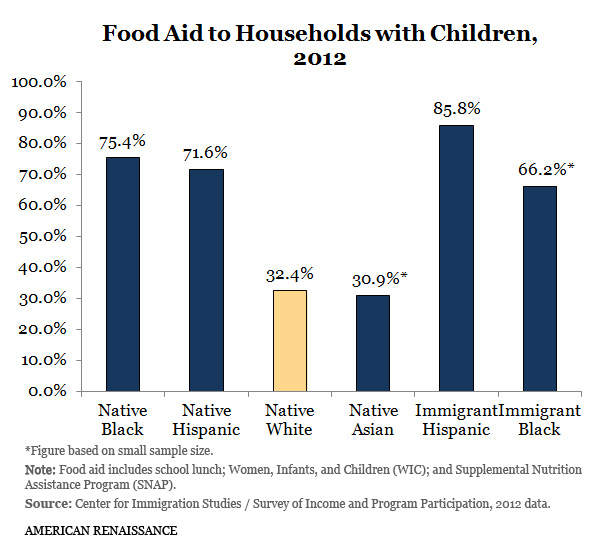
Among all households, native blacks and Hispanics receive food handouts at three times the white rate; for Hispanic immigrants, the figure is four times the white rate. Among households with children, nearly all immigrant Hispanics–86 percent–get food aid. Native blacks and Hispanics aren’t far behind, with rates of 75 and 72 percent, respectively.
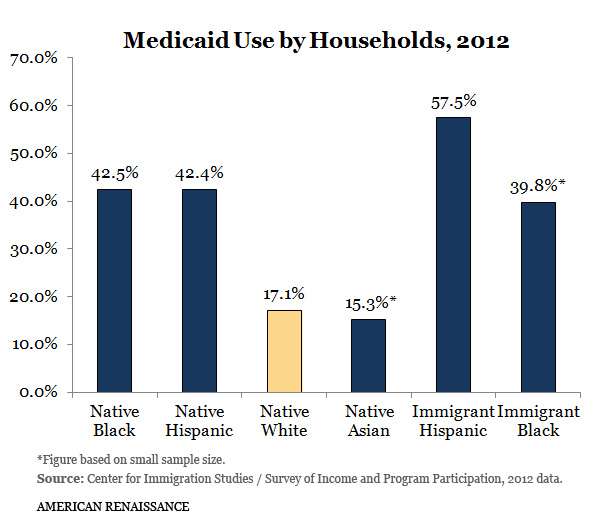
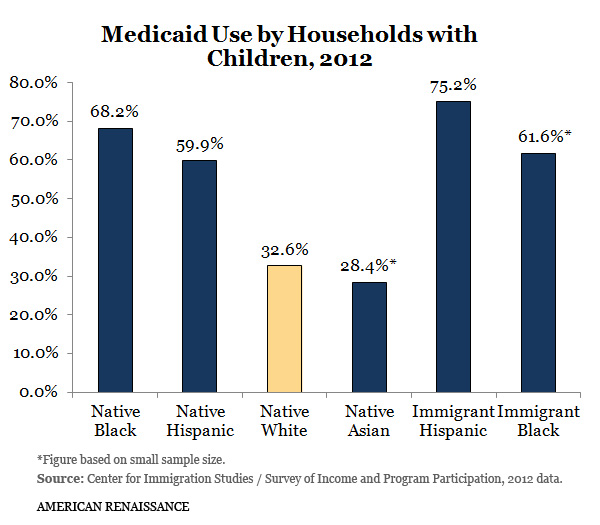
It’s clear, too, that non-whites benefit disproportionately from Medicaid, which helps explain why red states have opted out of Medicaid expansion.
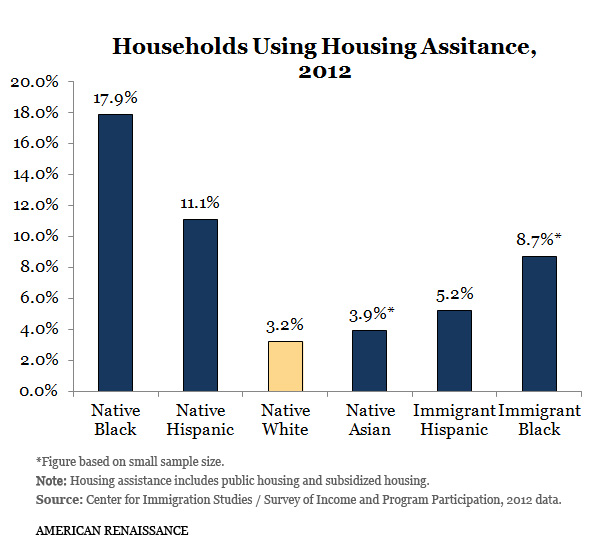
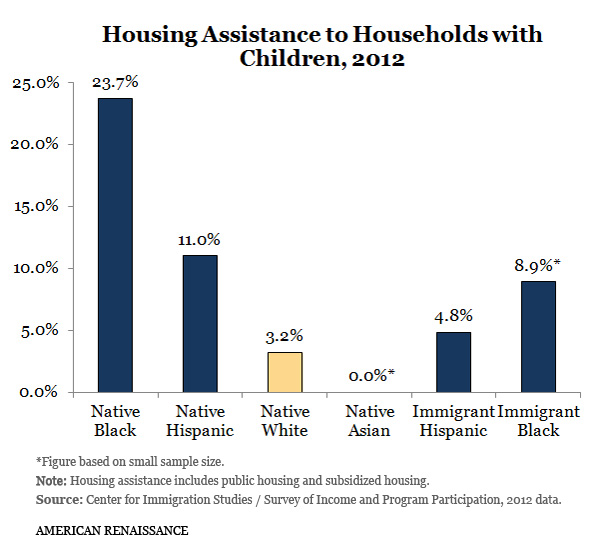
Native Hispanics and blacks, especially, are also heavy users of housing assistance. Among households with children, native Hispanics use these programs at nearly four times the white rate and blacks at seven times the white rate. Some effort is made to limit the access of illegal immigrants to subsidized housing, which helps explain why Hispanic immigrants get housing handouts at less than half the rate for native Hispanics. Amnesty for illegals would mean a sharp rise in the percentage of Hispanics in public or subsidized housing.
Spreading the wealth around
For each of the four welfare categories presented above, the black and Hispanic rates are at least double the white rates. Native Asians appear to use welfare at slightly lower rates than whites, but their SIPP sample size is too small to be certain. Asian immigrants, who are not included in the charts above, exceed native white welfare rates by about 25 percent (see table A3 in the CIS report). The US has three times as many immigrant Asian households as native Asian households.
What little public discussion there is of disproportionate welfare use by blacks and Hispanics is inevitably muddied by the claim that the majority of those receiving welfare are white. This ignores the fact that there are five times as many whites as blacks and four times as many whites as Hispanics in the United States; what matter are differences in the rates at which each group uses welfare. Furthermore, at least in terms of households, this claim is no longer true.
According to data in the CIS report, there are 39.88 million households in the US receiving some sort of means-tested welfare. Of those households, just 19.66 million–or 49 percent–are either native or immigrant whites (Middle Eastern immigrants are classified as “whites”). That means the majority of US households on welfare are now non-white.
As mass Third-World immigration continues, the US will have an ever-burgeoning dependent class of non-whites. Black voters will be joined by increasing number of Hispanic voters in their support for more handouts. When they vote in 2016, a majority of black and Hispanic households are likely to be on welfare–just as they were in 2012. Arguments about freedom and limited government will mean nothing to them. Obamacare is just the beginning.
Whites must decide if this is the future they want for their children and grandchildren. If they don’t take action soon, blacks and Hispanics will decide for them.


