Murders Shot Up in 2015
Jared Taylor, American Renaissance, November 18, 2016
The Bureau of Justice Statistics (BJS) of the Department of Justice (DOJ) has released its annual “Crime in the US” report for 2015, and as has been widely noted, arrests for violent crime were up 3.7 percent over the previous year. Murder–up 11.8 percent–showed a sharper rise than at any time in the last 25 years. This rise in violent crime is a reversal of a steady, almost continuous decline since 1994.
The BJS reported 10,800,000 arrests in 2015, slightly down from the 11,200,000 in 2014. However, in keeping with the rise in violent crime, arrests for murder were up 4.9 percent to 11,902. Arrests for rape (22,863), robbery (95,527), and aggravated assault (376,154) were all up a few percentage points as well.
Most commentators consider the BJS figures complete and accurate, but they are not. First, not all police agencies in the United States report crime information to DOJ. In 2015, the BJS got information from police departments that cover 247 million Americans. That left out 22.8 percent of the total 2015 US population of 320 million, so those crime data are completely missing from the report. Sometimes the BJS estimates what the actual national totals should be; sometimes it doesn’t.
Furthermore, the information that 77.2 percent of the country reported to BJS was inconsistent. In particular, some agencies distinguished whites from Hispanics, but many just lumped Hispanics in with whites. The BJS reports the Hispanic/non-Hispanic information it gets from local agencies, but the information is so incomplete that most of the time it is impossible to calculate separate crime rates for whites and Hispanics. They have to be treated as a single group.
Finally, the BJS reports numbers of arrests, which are far different from the actual numbers of crimes. Every year, millions of crimes are not even reported to the police, and even when they are, yet more millions of crimes do not lead to an arrest. For example, the National Crime Victimization Survey, which asks a huge sample of Americans about their experiences as crime victims found 578,580 cases of robbery in 2015, of which 358,141 were reported to the police. However, in 2015, police made only 95,527 arrests for robbery, which was just 26.7 percent of robberies reported to the police, and 16.5 percent of the robberies reported by Americans in the survey. (Interestingly, the victimization survey, which is a more accurate assessment of actual crime than arrest figures, found no increase in violent crime in 2015. There is no doubt about the rise in murders, however; police found the bodies.)
There is another reason arrests are not the same as crimes: some arrests lead to release without a charge and others end in acquittal. However, extensive survey and other data confirm that comparing arrest rates for different racial groups is a reasonably accurate way to compare their actual crime rates.
Race and crime
There are two groups–blacks and Asians–for whom BJS figures are clear and consistent. It is therefore possible to calculate accurate arrest rates for these groups and compare them to everyone else in the American population. The following table shows the multiples of arrest rates for blacks and Asians compared to non-blacks and non-Asians, respectively.
| Black and Asian Multiples Compared to Non-Black and Non-Asian Offenders | ||
| Black | Asian | |
| Violent crime | 3.7 | 0.26 |
| Property crime | 2.5 | 0.20 |
| Murder and nonnegligent manslaughter | 6.8 | 0.26 |
| Rape | 3.1 | 0.27 |
| Robbery | 7.5 | 0.15 |
| Aggravated assault | 3.1 | 0.27 |
| Burglary | 2.7 | 0.20 |
| Larceny-theft | 2.5 | 0.20 |
| Motor vehicle theft | 2.7 | 0.22 |
| Arson | 1.9 | 0.22 |
| Other assaults | 2.9 | 0.20 |
| Forgery and counterfeiting | 3.2 | 0.26 |
| Fraud | 2.9 | 0.20 |
| Embezzlement | 3.8 | 0.29 |
| Stolen property; buying, receiving, possessing | 3.1 | 0.20 |
| Vandalism | 2.4 | 0.19 |
| Weapons; carrying, possessing, etc. | 4.3 | 0.19 |
| Prostitution and commercialized vice | 4.3 | 0.91 |
| Sex offenses (except rape and prostitution) | 2.0 | 0.33 |
| Drug abuse violations | 2.4 | 0.19 |
| Gambling | 8.4 | 1.15 |
| Offenses against the family and children | 2.8 | 0.12 |
| Driving under the influence | 1.0 | 0.34 |
| Liquor laws | 1.0 | 0.24 |
| Drunkenness | 1.1 | 0.17 |
| Disorderly conduct | 2.9 | 0.14 |
| Vagrancy | 2.4 | 0.17 |
| All other offenses (except traffic) | 2.5 | 0.17 |
| Suspicion | 2.5 | 0.17 |
| Curfew and loitering law violations | 5.3 | 0.17 |
Also, the table claims to distinguish between whites and Hispanics, but it does a bad job of it. For example, it reports that 633 of the 3,167 single offenders who killed a single white victim were Hispanic and that 1,086 were not. However, that leaves 1,448 offenders for whom the BJS has no idea whether they were Hispanic. This makes the information on Hispanics close to worthless.
The BJS issues a supplemental homicide report that purports to compare the races of murderers to the races of their victims, but it is not very useful. First, it includes only those murders that are known to have a single offender and a single victim–but such murders account for only 6,137 or just 45.6 percent of the 13,455 murders recorded by BJS in 2015. Blacks are, for example, arrested for murder at 6.8 times the rate for non-blacks, and Asians at just 26 percent of the non-Asian rate. If the federal figures distinguished clearly between and whites and Hispanics, it would be possible to make a comparison between black and white arrest rates, in which case the arrest multiple for blacks (when compared only to whites) would be higher. This is because, as we know from states such as California that carefully distinguish Hispanics from whites, Hispanics are about twice as likely as whites to commit such crimes as rape, murder, and robbery. A comparison of black arrest rates to all non-blacks means comparing them to Hispanics as well as whites (and to the small percentage of the population that is Asian), which lowers the figures in the above table.
If we treat whites and Hispanics as a single group, we know that any individual black is 14 times more likely to kill a white or a Hispanic than the other way around. Again, the multiple would be higher if we were comparing blacks only to whites. We can also say with some confidence that a Hispanic is 2.7 times more likely than a white to kill a black person, and it appears that in this partial sample, more whites are killed by Hispanics (633) than by blacks (500). When a black is killed, 89.3 percent of killers are black. The BJS is mum on race in cases of murders involving multiple victims or killers.
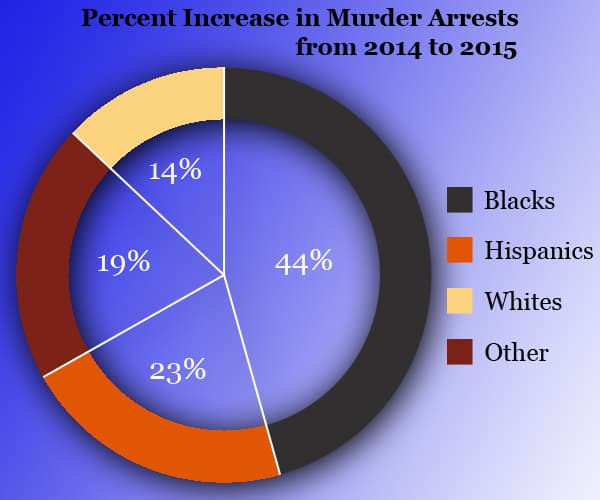
The dramatic 11.8 percent rise in murders reported for 2015 has received a lot of attention, but is any particular racial group responsible for the increase? Both the BJS figures and press reports are silent on this question.
To arrive at the 11.8 percent increase, BJS–using data and estimates for the whole country and not simply passing on the partial data officially reported to it–says there were 15,192 murders in 2015, up from 13,594 in 2014. We can compare this increase to reported changes in the number of people of different races arrested for murder. BJS reported only 8,508 murder arrests for 2015. This low figure reflects not just that many murderers were not caught but also the limited reporting from police agencies that cover only 77.2 of the US population. But within this partial sample, there are race differences in the increase in arrests for murder. Compared to the total 2014 arrest figures, black arrests for 2015 were up by 123, Hispanic arrests by 62, “Others” (including American Indians and Pacific Islanders) by 54, and whites by only 39. Blacks therefore accounted for 44 percent of the increase from 2014 to 2015, Hispanics for 23 percent, and whites for only 14 percent. (These figures are based on BJS’s very partial reporting on Hispanics that certainly understates the number of Hispanic arrests for murder).
A different calculation is possible based on BJS reports on race of murder offenders. Obviously the police don’t know the races of offenders they have not caught, and the proportion of “race unknown” rose from 29.7 percent in 2014 to 31.2 percent in 2015. For offenders whose race was known, the black increase was 447, as opposed a white increase of 221 and a Hispanic increase of 48. By this calculation as well, it is blacks–who were only 13.3 percent of the population–who accounted for the bulk of the rise in murders from 2014 to 2015.
There is an important BJS table that most people ignore. It is a supplemental table that lists arrests by race for criminals under the age of 18. This is one set of data for which the Hispanic/non-Hispanic data appear to be reliable, and the results are dramatic. The following table lists the multiple of the white arrest rate for blacks, Hispanics, and Asians for various crimes, along with the number of such crimes.
| Multiples of White Arrest Rates for Offenders Under Age 18 | ||||
| Number | Black X | Hisp X | Asian X | |
| Violent crime | 39,323 | 9.34 | 1.96 | 0.43 |
| Property crime | 160,234 | 4.28 | 1.11 | 0.41 |
| Murder and nonnegligent manslaughter | 601 | 18.98 | 3.61 | 0.16 |
| Rape | 2,715 | 2.81 | 0.82 | 0.24 |
| Robbery | 14,142 | 35.83 | 5.03 | 0.95 |
| Aggravated assault | 21,865 | 5.86 | 1.64 | 0.37 |
| Burglary | 27,344 | 5.73 | 1.56 | 0.36 |
| Larceny-theft | 119,712 | 3.84 | 0.99 | 0.41 |
| Motor vehicle theft | 11,111 | 8.62 | 2.14 | 0.28 |
| Arson | 2,067 | 1.77 | 0.67 | 0.16 |
| Other assaults | 100,264 | 4.46 | 1.10 | 0.24 |
| Forgery and counterfeiting | 786 | 4.08 | 1.13 | 0.23 |
| Fraud | 3,425 | 5.27 | 0.69 | 0.42 |
| Embezzlement | 443 | 4.17 | 0.84 | 0.38 |
| Stolen property; buying, receiving, possessing | 7,941 | 10.37 | 1.80 | 0.55 |
| Vandalism | 31,840 | 2.37 | 0.87 | 0.23 |
| Weapons; carrying, possessing, etc. | 14,687 | 6.80 | 2.33 | 0.65 |
| Prostitution and commercialized vice | 442 | 11.31 | 1.18 | 0.68 |
| Sex offenses (except rape and prostitution) | 6,632 | 2.27 | 0.95 | 0.30 |
| Drug abuse violations | 75,461 | 2.01 | 1.20 | 0.26 |
| Gambling | 355 | 58.92 | 5.72 | 2.85 |
| Offenses against the family and children | 2,597 | 2.78 | 0.73 | 0.19 |
| Driving under the influence | 4,993 | 0.39 | 0.70 | 0.26 |
| Liquor laws | 32,663 | 0.40 | 0.44 | 0.18 |
| Drunkenness | 4,209 | 0.93 | 1.85 | 0.29 |
| Disorderly conduct | 54,686 | 4.83 | 0.92 | 0.21 |
| Vagrancy | 820 | 7.66 | 3.28 | 0.57 |
| All other offenses (except traffic) | 127,312 | 2.86 | 1.05 | 0.25 |
| Suspicion | 144 | 1.63 | 0.24 | 0.00 |
| Curfew and loitering law violations | 33,700 | 5.85 | 1.20 | 0.34 |
Here is a graph of some of the same data:
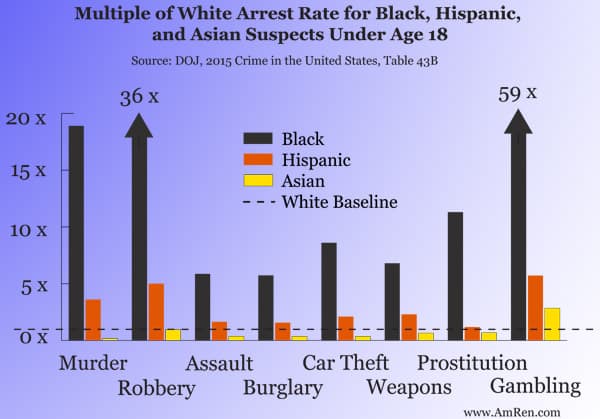
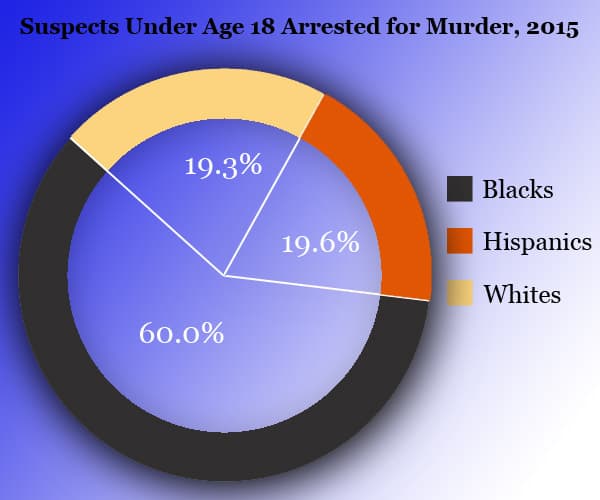
Juveniles committed 601 murders, for example, and blacks were arrested for 361 of them, Hispanics for 118, and whites for only 116. When these figures are compared to the under-18 population (whites: 37.8 million, blacks: 9 million, Hispanics: 18.1 million, Asians: 3.5 million) black juveniles are arrested for murder at nearly 19 times the white rate, with Hispanics at 3.6 times the white rate. The arrest multiples for robbery are even more extreme: 35.8 times for blacks and 5 times for Hispanics. Whites were arrested for only 11.8 percent of the 14,142 robberies committed by juveniles in 2015.
It is common to argue that whites commit much more white-collar crime than blacks, but this not true either for adults or juveniles. Young blacks are arrested at four to ten times the white rate for such crimes as forgery, embezzlement, and receiving stolen property. Arrest rates for young Hispanics are generally equivalent to those for whites. Only for alcohol-related crimes are blacks arrested at lower rates than whites.
With the exception of violations of gambling laws (and the number of offenders is small), Asian juveniles, like Asian adults, consistently have the lowest arrest rates. It remains to be seen whether race differences in arrest rates will continue to be this striking as these juveniles get older.
The feds usually know the race and sex of murder victims–but not always. Of the 13,455 bodies recovered by the police in 2015, 78.8 percent were male and 20.9 percent were female, but the sex of 29 victims was unknown. Proportionately, a lot more white (including Hispanic) women are killed–they are 29.5 percent of victims–than black women, who are just 13.1 percent of black victims. This is probably because most whites are killed by other whites, and this includes the usual share of men killing their wives or girlfriends (when a married woman is killed her husband is automatically the prime suspect), whereas a disproportionate number of black-on-black murders involve young men killing each other for trivial or gang-related reasons. Also, there are always a certain number of white (and Hispanic) women killed by black men, but white men almost never kill black women.
From this table we know with confidence that a black person is 7 times more likely to be murdered than a non-black. Black men are 9.7 times more like than non-black men to be murdered while black women are only 3.3 times more likely than non-black women to be murdered. The data do not permit direct comparisons to whites because, as usual, whites are not distinguished from Hispanics.
The BJS also tracked kinds of weapons used to kill people in 2015. Not surprisingly, firearms are the leading category, and are used in 71.5 percent of murders. The huge majority of these firearms were handguns, while rifles–of all kinds–were known to be used in only 1.9 percent or 252 cases. Despite the hullabaloo about “assault weapons,” they are very rarely used as a murder weapon. More people are killed with hands and feet (624), knives (1,544), and blunt instruments (437) than with rifles of all kinds. In 2015, murderers took the trouble to drown 14 victims and strangle or asphyxiate 216. The government has no data on racial differences in murder weapons.
There are regional differences, however. In Missouri, only 5.2 percent murderers used knives (the national percentage is 11.5 percent), whereas in New Hampshire fully 42.9 percent sliced up their victims. However, the New Hampshire sample is small: There were only 14 killings in the state in 2015, six of which were with knives. In general, the West has higher rates of knifings than the East–perhaps because of larger populations of Hispanics and American Indians.
There is a similar pattern in beating or stomping people to death. In the nation as a whole, only 4.6 percent of people are killed that way, and several states report no such deaths at all. These kinds of killings are most common in Utah–16.7 percent, South Dakota–18.5 percent, Montana–19.4 percent, North Dakota–23.5 percent, and Hawaii–36.8 percent. The Hawaiian sample is small, but the high rate is probably accounted for by Samoans, who apparently prefer to beat people to death rather than use a weapon.
The BJS collects statistics on justified killings of criminals by police officers and civilians but they are incomplete. For 2015, for example, it reported 441 police shootings of criminals, but, in an exhaustive compilation from news reports, the Washington Post found 990 such shootings. Assuming that the BJS figures are consistently incomplete, with the same agencies failing to report to Washington every year, there is no sign that police shootings are on the rise: In the past three years they have declined from 467 to 451 to 441.
According to the BJS, civilians lawfully killed 328 criminals in 2015. That figure is probably just as incomplete as the one for police shootings, but it is up from 286 in 2013 and 277 in 2014.
How many crimes do the police solve? The following table show the rates at which various crimes are “cleared,” to use police lingo. Violent crimes are usually easier to solve than property crimes, and the police put more effort into solving them. Still, only 46 percent of violent crimes result in an arrest and only 19.4 percent of property crimes. Only about one in eight car thefts leads to an arrest.
| Percent of Known Offenses That Were Cleared | ||
| Offenses known | Percent cleared | |
| Violent crime | 1,131,223 | 46.0 |
| Murder and nonnegligent manslaughter | 14,392 | 61.5 |
| Rape | 7,518 | 36.2 |
| Robbery | 299,232 | 29.3 |
| Aggravated assault |
707,017 | 54.0 |
| Property crime | 7,332,702 | 19.4 |
| Burglary | 1,450,074 | 12.9 |
| Larceny-theft | 5,225,538 | 21.9 |
| Motor vehicle theft | 657,090 | 13.1 |
| Arson | 40,260 | 20.4 |
Clearance rates used to be higher, especially for violent crime. In 1976, the homicide clearance rate was 80 percent. The decline is due to the fact that more murders are now committed by people who are strangers to each other, which leaves the police very few clues.
Besides the serious deficiencies in federal crime data noted above, the 2015 National Crime Victimization Survey failed to report the data on the race of perpetrators. The NCVS survey of violent crime victims always asks for the race of the perpetrator, so the BJS has this information. However, since taking office, the Obama administration has almost never released it. Heather Mac Donald of the Manhattan Institute managed to get and publish the data for 2013, but the 2015 data are still locked up somewhere at DOJ.
Our analysis of the 2013 data found that of the 650,000 acts of violence involving blacks and whites, blacks were the attackers 85 percent of the time, which meant any given black was 27 times more likely to attack a white than the other way around. It is no doubt because of these dramatic race differences that Attorney General Loretta Lynch and her predecessor Eric Holder have refused to release these data.
We hope that a Trump administration will not only release full perpetrator data but also encourage all police agencies clearly to distinguish between white and Hispanic criminals. Until this is done, accurate racial comparisons of arrests at the national level will be impossible.
[Editor’s Note: For a comprehensive analysis of race and crime in the United States, see our 2016 report: “The Color of Crime.”]


