For Whom the Bell Curves
Jared Taylor, American Renaissance, February 1995
The Bell Curve: Intelligence and Class Structure in American Life, Richard Herrnstein and Charles Murray, The Free Press, 1994, 845 pp.
Despite the blizzard of indignant reviews it has provoked, The Bell Curve is largely devoted to proving something that virtually all Americans once knew, and that many who have not had the sense knocked out of them by a college education still know: A person’s intelligence is pretty well set at birth, and is likely to make a huge difference in how he turns out. Liberals pretend not to believe this, and since they set the intellectual tone for the country, the book has caused a scandal. Let the scandal continue. It has already pushed sales past three hundred thousand, and some of the people who buy this book will actually read it. They will find that it demolishes the assumptions behind nearly every social policy of the last three decades.
The NLSY
At the heart of the book is an extensive analysis of something called the National Longitudinal Survey of Youth (NLSY). This is a huge study, begun in 1979, of more than 12,000 American young people who were carefully chosen to be representative of the nation as a whole. The survey seems to have been conceived according to the classic, liberal conviction that a person’s family or school background causes social pathology; the study was meant to gather information to prove it. Like almost all contemporary social research, the NLSY ignored intelligence as a possible causal factor.
IQ scores for NLSY participants were collected by pure coincidence. The U.S. Army needed to update the norms for the Armed Forces Qualification Test (AFQT), and rather than go to the bother of finding another nationally representative sample, it simply gave the test to the NLSY participants. Since the AFQT is the equivalent of an IQ test, the NLSY suddenly and accidentally made it possible to show whether intelligence — independently of family background — predicts success or failure in life.
As the authors of The Bell Curve point out in relentless detail, intelligence is the crucial variable. The graph on this page is only one of many from the book that make this point dramatically. The steep curve shows the effect IQ differences have on the likelihood of otherwise average members of the NLSY sample being poor — average in both age and parents’ socio-economic status (SES). The gentler curve shows the effect of parents’ SES on the likelihood of people of average intelligence being poor.
This graph shows that people with average IQs had about an eleven percent chance of being poor if their parents were from the very bottom of the social scale. But for people with similarly average intelligence, having the most upscale parents possible reduced their chances of being poor by only about half — to five percent.
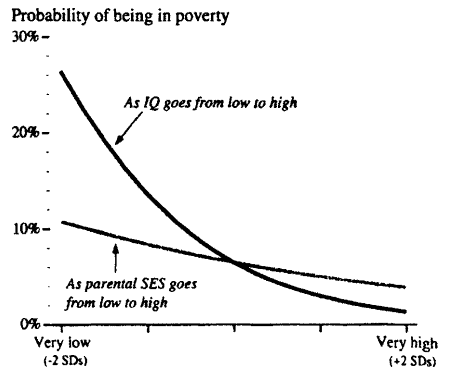
Intelligence was vastly more important than parents’ SES. Among people who had entirely average family backgrounds, the least intelligent had about a 26 percent chance of being poor, whereas the most intelligent had perhaps a two percent chance of being poor. IQ — for people who came from average families — made a 13-fold difference in the likelihood of being poor. Family background — for people with average IQs — made only a two-fold difference. In similar manner, The Bell Curve demonstrates that low intelligence is by far the most important predictor for most of the other things the country is presumably worried about: crime, welfare, illegitimacy, unemployment, etc.
The difference IQ makes can be expressed in other ways. For example, 82 percent of the poor people in the NLSY sample have below-average IQs, as do 90 percent of the chronic welfare recipients. Ninety-five percent of the children living in poverty have mothers with below-average IQs. Low-IQ parents also tend to be bad parents; child abuse and neglect are overwhelmingly concentrated among the poor and unintelligent.
Data like these are tremendously important. Conventional liberalism has always taken it for granted that schools or childhood environment rather than native intelligence makes people succeed or fail. This is why liberalism has exhausted itself trying to “enrich” the households of the poor and beat a high-school education into boneheads. The Bell Curve shows that the entire uplift movement has willfully ignored the variable that matters most: IQ. Fiddling with Head Start and school lunches is largely a waste of time if it does not raise intelligence.
As the authors suggest, liberals actually know this. That is why, despite their hostility towards IQ, they trumpet the news whenever they think they have found a way to raise it. The Bell Curve carefully sifts through the data to show that not even the most intensive versions of Head Start have an enduring effect on intelligence or on school performance, despite extravagant claims by their boosters. As the book explains, this is not only because intelligence is largely hereditary, but because researchers cannot figure out what actually affects the part of it that is theoretically subject to environmental manipulation. IQ can be lowered through severe malnutrition or sensory deprivation, but within a very broad range of ordinary human environments, little can be done to raise it.
Racial Differences
As if all this were not bad enough, the authors also discuss race and IQ. Although this part of the book has received the most attention, it is nothing more than a summary of familiar data. Far more interesting is how Messrs. Herrnstein and Murray use the racial data from the NSLY. It is well known that blacks and Hispanics have lower average IQs than whites and that, as groups, their behavior bears the stigmata of lower intelligence. But what do we find when we compare people of different races who have the same IQ scores? The results are edifying.
For example, although whites are two and a half times more likely than blacks to graduate from college, blacks with a typical college-graduate IQ (114) are 36 percent more likely than whites of the same IQ to graduate from college. Likewise, although NLSY whites are 67 percent more likely than blacks to be in what The Bell Curve calls “high-IQ jobs,” blacks with the requisite IQ (117) are 2.6 times more likely than whites of the same IQ to hold such jobs. This would appear to be clear evidence that blacks benefit from racial preferences.
Despite these preferences, controlling for IQ does not make the undesirable differences in racial behavior go away. The likelihood of various forms of failure among nonwhites can be expressed as a multiple of the white likelihood for the same behavior. For example, blacks in the NLSY sample are 3.7 times more likely than whites to be poor, and Hispanics are 2.6 times more likely. What about a comparison only of those blacks, whites, and Hispanics with the same IQ of 100? The multiples diminish, but do not go away: Blacks — 1.8x, Hispanics — 1.5x. The chart below summarizes other similar findings.
| Black | Hispanic | |
|---|---|---|
| Poor | 3.7x | 2.6x |
| IQ Adjusted | 1.8x | 1.5x |
| On Welfare | 3.8x | 2.3x |
| IQ Adjusted | 2.5x | 1.2x |
| Had Illegitimate Child | 5.2x | 1.9x |
| IQ Adjusted | 5.1x | 1.7x |
| Incarcerated | 6.5x | 3.0x |
| IQ Adjusted | 2.5x | 1.5x |
What do these data mean? Society at large — at least universities and employers — appears to give nonwhites preferential treatment. Yet many fail to take advantage of these preferences, and are more likely than whites of the same IQs to be poor, go on welfare, or go to jail. When it comes to having illegitimate children, restricting the comparison to groups with the same IQs has virtually no effect: Hispanics and blacks are still twice and five times more likely than whites to have children out of wedlock.
Whatever causes these persistent differences between groups with the same IQs probably explains why it is that when blacks and whites get the same SAT scores, the whites are likely to get better grades in college. To use the technical term, standardized tests “overpredict” black success. The data on racial multiples for social failure can be viewed the same way: IQ scores overpredict nonwhite law-abidingness, self-sufficiency, likelihood of having a legitimate child, etc. In other words, even when blacks and Hispanics are as smart as whites, they still do not behave like whites. (It would be interesting to have comparable data for Asians.)
Though The Bell Curve ducks the issue, this suggests that there is more to racial differences than IQ. There may be differences in hormone levels, willingness to defer gratification, self discipline, or any of the other areas that Philippe Rushton has investigated. These would account for greater failure levels for nonwhites compared to whites with the same intelligence.
Liberals might argue that nonwhite deviance remains high even when IQ is held constant, only because “racist” white society does not recognize the abilities of nonwhites. Yet the data on employment and college graduation suggest that “racist” white society over recognizes nonwhite ability.
There is one more complicating piece to this puzzle: According to NLSY data, whites and nonwhites of the same IQ are paid almost identical wages. This suggests equal treatment by employers, and contradicts the earlier suggestion that nonwhites enjoy racial preferences on the job. However, if the races really do differ in the many ways that Prof. Rushton has found — that is, not just in intelligence — and these differences make nonwhites less desirable employees, paying them at the same rate for the same IQ is a form of preference. At the very least, blacks are receiving equal treatment, which belies the liberal argument that “racism” explains nonwhite deviance.
Future Generations
Some of The Bell Curve’s most important and provocative findings are about dysgenics. The authors point out that dull people are having more children than bright people. They are also having them at earlier ages, so we are likely to have five large generations of dull people by the time we have had four small generations of bright people.
Since the children of NLSY women have been tested for intelligence, we now know the extent to which low IQ is being passed on from one generation to the next. For example, women in the bottom 20 percent of IQ (87 and below) produced 72 percent of the children with IQs of 80 or below.
The NLSY data also suggests that the racial gaps in intelligence are widening. The black-white IQ gap for NLSY mothers is 13.2 points; the black-white gap for their children is 17.5 points. Likewise, the Hispanic-white IQ gap for mothers is 12.2, while the gap for children is 14.1. As the authors point out, since these gaps are between mothers (not the whole NSLY population) and their children, there is no obvious reason why they should be growing wider.
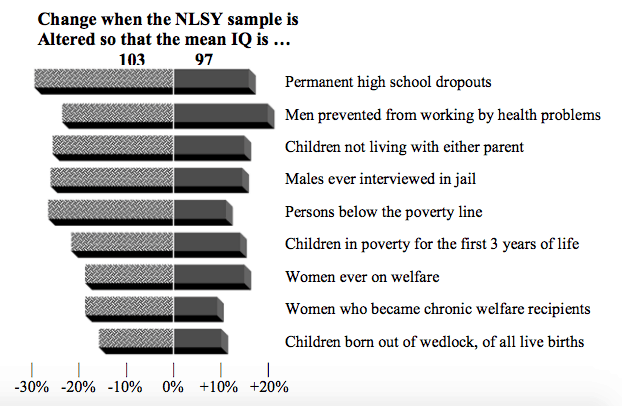
It is likely that dysgenic trends are pushing America’s average IQ down by one or two points every generation. This may not seem like much, but a small shift in the average makes a big difference. Messrs. Herrnstein and Murray statistically manipulated the NLSY sample to see what effect a three-point drop — or a three point rise — in average IQ would have on levels of social failure. The above graph shows the results. For example, lowering the average IQ by just three points increases the high school dropout rate by 14 percent, while raising the average IQ by the same amount reduces it by 30 percent.
What appear to be insignificant shifts at the average could quickly change the entire profile of our population and make it impossible to support institutions we take for granted. The long-term consequences of differential birth rates are an extremely serious matter, but one that American society resolutely ignores.
On the other hand, it is worth noting that The Bell Curve does not assume an inevitable association between low IQ and social pathology. It points out that the explosion of crime and illegitimacy in the 1960s was so sudden it cannot have been caused by dysgenic drift. Before that decade, people of low intelligence were coping with life better than they did after it. The social forces that were loosed upon the country — and the authors are candid about not entirely understanding them — hit all Americans, but they hit people with low IQs hardest.
A Wide-Ranging Work
This review has touched on only a few of the subjects that The Bell Curve covers in fascinating detail. For example, the book describes how the demands of a modern economy are segregating smart people from the rest of the population, both occupationally and residentially. It shows that the best and easiest way for an employer to get a good work force is to give job-seekers a 12-minute intelligence test. It discusses the damaging effect of massive immigration from low-IQ, nonwhite countries. It describes the tyrannical consequences of government attempts to force equality upon unequal people. It includes an excellent summary of how affirmative action really works, and it describes how schools lavish so much attention on dimwits that gifted children are shortchanged. The book is stuffed with hard data and good arguments.
So where do we go from here? Most of the book’s recommendations are “controversial” but obvious: abolish affirmative action, restrict immigration, end welfare, beef up programs for gifted children. One cannot expect these authors to go any further than this.
As for race, they seem to think it is nothing more than a statistical artifact. They write that if the country stops counting by race and treats people as individuals, “group differences can take their appropriately insignificant place in affecting American life.” This naive view is perhaps obligatory even for people who break other taboos, but it need not overly trouble us. The Bell Curve is a great leap forward in the debate about the forces that are grinding our country down. It is a remarkable achievement, a milestone on the road back to national sanity.


