AmRen Poll: White Americans Waking Up on Race
AR Staff, American Renaissance, September 24, 2021

This spring, AmRen conducted a poll of white Americans about their views on race and immigration. According to how they replied to a series of questions, we categorized respondents in three groups: racial conservatives, racial liberals, and those who are neither.
Major findings:
- White racial conservatives (26 percent of white Americans) outnumber white racial liberals (16.8 percent).
- A majority of whites in the Republican Party are racial conservatives.
- Measured according to which issues are most important to them, white racial conservatives feel more strongly than white racial liberals about racial issues.
- White identity is important to many whites across the political spectrum, but the strength of that identification influences their political views. In general, white Republicans and conservatives are much more likely to say that their race is extremely important or very important to their identity.
- White Americans as a whole are trending to the right and have been doing so — at least in terms of partisan identification — for several decades. This trend continues under President Biden.
- Racial issues were the top driver of ideological change among whites over the past decade.
White Racial Views: White racial conservatives outnumber white racial liberals
We used the questions in the following table to determine views on race and immigration. They are sorted according to how much support they drew from American whites, from most to least. We used the questions with asterisks to categorize respondents as racial conservatives or racial liberals.
White Support for Conservative Racial Positions
| Because all racial groups are equal in ability, all group differences in achievement are due to racism (disagree) |
60.9% |
| I think America should have “hate speech” laws that make racist statements illegal (disagree) |
58.9% |
| I support the Black Lives Matter movement (disagree) * | 51.7% |
| We should strengthen affirmative action for minorities (disagree) * | 51.6% |
| We should decrease immigration (agree) * | 48.9% |
| My race is important to my identity (agree) | 45.8% |
| I think white people in the U.S. have certain advantages because of the color of their skin (disagree) * |
45.7% |
| I think systemic racism in America oppresses minorities independently of racist behavior by whites (disagree) |
42.6% |
| America’s political divide is becoming so great that we may be better off allowing some states to secede and go their own way (agree) |
28.7% |
| A diverse America where most of the population are racial minorities will be good for the nation (disagree) |
25.1% |
* These issues are used to define racial conservatives and racial liberals in this analysis.
Of the ten questions asked, the two racially conservative views that drew the most support were disagreement with the view that all group differences in achievement are due to racism and opposition to hate speech laws. Near the bottom of the list, however, only a little more than a quarter of whites (28.7 percent) support secession. Perhaps surprisingly, even fewer whites (25.1 percent) are willing to disagree with the liberal view that “a diverse America where most of the population are racial minorities will be good for the nation.”
The middle of the table is dominated by policy-related or political issues such as immigration, affirmative action, and support for Black Lives Matter. Support for these issues tends to split along party lines.
How many whites are racial conservatives and how many are woke racial liberals? In this analysis, we defined a racial conservative as someone who consistently takes the conservative position on four issues: Black Lives Matter, affirmative action, immigration, and white privilege. Racial liberals are whites who take the liberal position on those four issues.
According to this definition, 26 percent of American whites are racial conservatives. Substantially fewer (16.8 percent) are racial liberals. A majority of whites (57.3 percent) fall somewhere in the middle, with a mix of racially conservative and liberal views.
A majority of white Republicans (51.8 percent) are racial conservatives. Most racial conservatives define themselves politically as either conservative or extremely conservative. A majority of racial conservatives (nearly 60 percent) are men.
Most white Democrats (55.8 percent) are racial moderates. A smaller share of Democrats (42.1 percent) are racial liberals. Most racial liberals define themselves politically as either liberal or extremely liberal. About two-thirds of racial liberals are women.
Most Important Issues: White racial conservatives feel more strongly about racial issues than white racial liberals
Our poll also included an open-ended question that asked poll respondents to identify — without prompting — their top three most important issues. Based on this question, racial issues appear to be more important to right-leaning whites than to left-leaning whites.
As shown in the table below, the top issues for white Republicans are race-related (including immigration, crime, and opposition to woke issues coming from the Left). Classic small government issues, such as cutting spending and reducing taxes, come in a distant second. Abortion and gun rights are further down the list. No other issue commanded more than 10 percent support in our open-ended question.
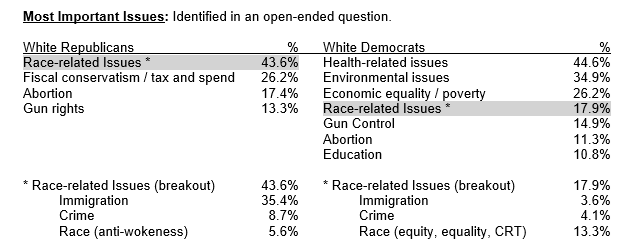
Among white Democrats, the top three most important issues are healthcare, the environment, and non-racial economic equality issues such as raising the minimum wage, helping the poor, and taxing the rich. Race-related issues are much further down the list — mentioned by just 17.9 percent of white Democrats.
Fifty percent of white racial conservatives listed race-related issues among their top three issues. Among white racial liberals, a comparably lower 36.1 percent listed race-related issues in their top three.
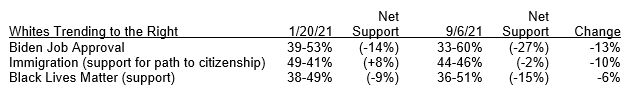
Trends: Whites as a whole are trending to the Right, especially under President Biden
In what direction are whites trending politically? There is substantial evidence that some have been trending to the Left in recent years, particularly on matters of race. The influence of this group is quite significant, especially within the Democratic Party.
However, according to our poll, more whites overall are trending more to the Right than to the Left. Specifically, 34.1 percent of white Americans say they are more conservative than they were a decade ago, while just 26.8 percent say they are more liberal. This is consistent with a longer-term trend among whites, who have been steadily moving away from the Democratic Party for the last 60 years.
A detailed statistical analysis of whites who say they have become more conservative or liberal over the past decade reveals that racial issues are far and away the top determinant of ideological change. Medical issues (Medicare / Obamacare) are a distant second. Given the role that race has played on both the Left and Right, especially since the Great Awokening, this should not be surprising.
This longer-term trend has accelerated under President Biden. The polling organization Civiqs has conducted an online poll on a variety of issues this year that is updated daily. According to that organization, white voters have been moving to the Right since the President was inaugurated. This is true not just for the President’s job approval, but also for race-related issues such as immigration and support for Black Lives Matter.
White Identifiers: The strength of white identity matters more than white identity itself.
According to our poll, 45.8 percent of whites say that race is important to their identity, a figure that is consistent with many other polls that have asked this question. Perhaps surprisingly, however, white identity only modestly correlates with political ideology. Large numbers of white Democrats (43.1 percent) — and even white racial liberals (28.1 percent) — say their race is important to their identity. There is little indication from this that white identity is having much impact on the opinions of these whites.
However, a simple binary (agree/disagree) question like this fails to capture the strength of these opinions, and this appears to be the key difference. A separate 2019 ANES poll, which asked how strongly whites felt about their racial identity, found that white conservatives and white Republicans are far more likely to feel strongly about it.
According to that poll, 32.8 percent of white Republicans say their race is either extremely important or very important to their identity. By contrast, just 19 percent of white Independents and only 12.2 percent of white Democrats feel the same way.
Implications for white advocacy
There are still 198 million whites in the United States. About 20 percent of them are under the age of 20, which leaves about 158 million adult, voting-age whites. If 26 percent are racial conservatives, that means 41 million white Americans should be receptive to a message of white advocacy. This is a huge population, from which it should be possible to recruit a potentially decisive number of activists.
By the same calculation, there are only 26.6 million white adults who are racial liberals. Whites are still the group that generally establishes intellectual norms in the United States. The 26.6 million racial liberals — along with what is surely a large number of non-white racial liberals — are imposing their will on the 41 million white racial conservatives and the entire country. Racial liberals dominate the sectors that most strongly influence opinions: news media, publishing, Hollywood, universities.
The purpose of American Renaissance has always been to reach receptive whites, inspire them, and guide them. If our findings are correct, the rightward-shift in the attitudes of whites over the last decade means that the number of receptive whites is growing every year. Our work is more necessary — and more likely to bear fruit — than ever.
Methodological notes
One objective of our poll was to measure social desirability bias — the tendency of some people to lie and say they hold views that are more socially acceptable than their actual views. Extensive research has been done on this, including its impact on polling results for racial issues and immigration. In most cases, such research finds that there is a 15–20 percent difference between the public’s expressed opinions on these issues and their real views, which tend to be less politically correct.
Our poll tried to measure social desirability bias through what is called a list experiment, a common research tool used for this purpose. A description of list experiments and how they shed light on social desirability bias can be found here. It is a way to learn indirectly whether people are willing to take a controversial position. Polling respondents are divided into two randomly selected groups. All participants are asked how many statements from of list of positions they agree with. One group gets a list that includes the controversial statement. Comparing answers to the group that did not get the controversial statement — which is statistically identical to the one that did — allows you to infer how many people in the target group agreed with the controversial statement.
We found a lower level of social desirability bias (generally in the range of 4 to 8 percent) than has been found in the research more generally. The precision of these findings was somewhat undermined because some of our poll takers rushed through their answers, but the results were consistently in this 4–8 percent range across all of the race-related poll questions.
The reason for the discrepancy between our results and those in the broader research literature appears to be because our poll was conducted online, whereas most of the major studies that have been conducted on social desirability bias for race and immigration were telephone polls. Other studies by the Pew Research Center have found significant differences between online and phone polls on controversial issues such as immigration, racial discrimination, and the death penalty, with online polls tending to produce more conservative (i.e., more honest) results. The difference seems to average around 10 percent. A separate analysis of immigration polls by the Cato Institute found similar results.
This makes sense. Telephone polls are not anonymous (the pollsters know whom they are calling), and are usually conducted with a live interviewer. These conditions probably put more pressure on respondents to give politically correct answers.
Although our results came in low compared to other studies of social desirability bias, they were nevertheless instructive. We now have a useful rule of thumb for estimating social desirability bias without having to conduct another list experiment. To estimate social desirability bias, first estimate the average difference in opinions expressed in online polls versus telephone polls on any given issue when the list-experiment method is not used. This should be around 10 percent. Then add half of this amount to account for the residual bias in the online poll that we found by means of a list experiment, which winnows out false, social-desirability answers even further.
Added together — 10 percent plus 5 percent — gives a rough estimate of 15 percent for the amount of social desirability bias on any given controversial issue.
Summary Poll Results
The following poll results are based on an online poll of 578 non-Hispanic white Americans conducted from April 16 to May 30, 2021.
Poll results have been balanced by:
- Demographics, such as sex, age, and education.
- Political factors such as political party and self-reported political ideology (liberal, conservative)
- Whites’ support during the polling period for President Biden and for Black Lives Matter, as determined by polls on these two questions conducted by other organizations.
Demographics
| Sex | |
| Male | 47.2% |
| Female | 52.8% |
| Age [1] | |
| 18-29 | 12.8% |
| 30-44 | 28.5% |
| 45-64 | 39.6% |
| 65+ | 19.0% |
| Education [2] | |
| High school or less | 18.2% |
| Some college | 26.5% |
| College graduate | 40.0% |
| Post-graduate degree | 15.4% |
| Employment | |
| Employed full time | 66.4% |
| Employed part time | 18.5% |
| Not employed | 13.2% |
| Retired | 17.7% |
| Student | 1.8% |
Politics
| Political Party | |
| Democrat | 33.7% |
| Republican | 33.7% |
| Independent | 29.4% |
| Another Party | 3.1% |
| Political Ideology | |
| Extremely Liberal | 9.2% |
| Liberal | 17.3% |
| Slightly Liberal | 10.4% |
| Moderate | 21.3% |
| Slightly Conservative | 13.1% |
| Conservative | 21.5% |
| Extremely Conservative | 7.3% |
| Ideological Change Over Past 10 years | |
| Much more liberal | 10.4% |
| Somewhat more liberal | 16.4% |
| Stayed about the same | 39.1% |
| Somewhat more conservative | 22.1% |
| Much more conservative | 11.9% |
| Biden Approval | |
| Strongly approve | 20.2% |
| Somewhat approve | 22.3% |
| Strongly disapprove | 34.1% |
| Somewhat disapprove | 17.1% |
| Uncertain | 6.2% |
| Trump Approval | |
| Strongly approve | 20.8% |
| Somewhat approve | 22.5% |
| Strongly disapprove | 44.8% |
| Somewhat disapprove | 9.5% |
| Uncertain | 2.4% |
Racial ideology [3]
| Racial Conservatives | Racial Moderates | Racial Liberals | % of Sample | |
| All whites | 26.0% | 57.3% | 16.8% | 100% |
| Men | 30.4% | 57.9% | 11.7% | 47.2% |
| Women | 22.0% | 56.7% | 21.3% | 52.8% |
| Republicans | 51.8% | 48.2% | 0% | 33.7% |
| Independents | 25.3% | 68.2% | 6.5% | 29.4% |
| Democrats | 2.1% | 55.9% | 42.1% | 33.7% |
| Other Party | 26.0% | 57.3% | 16.8% | 3.1% |
| Extremely conservative | 59.5% | 38.1% | 2.4% | 7.3% |
| Conservative | 60.5% | 39.5% | 0% | 21.5% |
| Slightly conservative | 32.9% | 67.1% | 0% | 13.1% |
| Moderate | 16.3% | 74.8% | 8.9% | 21.3% |
| Slightly liberal | 5.0% | 83.3% | 11.7% | 10.4% |
| Liberal | 1.0% | 54.0% | 45.0% | 17.3% |
| Extremely liberal | 1.9% | 35.8% | 62.3% | 9.2% |
Racial questions
Note: After determining which respondents were racial conservatives and racial liberals, we categorized everyone else as racial moderates. In the tables below, racial moderates are broken out by partisan affiliation.
| 1. Identity: My race is important to my identity | ||||||
| All Whites | Racial Conservatives | Racial Moderates | Racial Liberals | |||
| GOP | Indep. | Dem | ||||
| Agree | 45.8% | 57.3% | 54.3% | 34.4% | 51.4% | 28.9% |
| Uncertain | 6.4% | 4.0% | 5.3% | 9.4% | 5.5% | 8.2% |
| Disagree | 47.8% | 38.7% | 40.4% | 56.3% | 43.1% | 62.9% |
| % of Sample | 100% | 26.0% | 16.3% | 22.1% | 18.9% | 16.8% |
| 2. Immigration: We should decrease immigration | ||||||
| All Whites | Racial Conservatives | Racial Moderates | Racial Liberals | |||
| GOP | Indep. | Dem | ||||
| Agree | 46.9% | 100% | 59.6% | 27.3% | 27.5% | 0.0% |
| Uncertain | 18.2% | 0.0% | 19.1% | 34.4% | 39.4% | 0.0% |
| Disagree | 34.3% | 0.0% | 21.3% | 38.3% | 33.0% | 100% |
| 3. Affirmative Action: We should strengthen affirmative action for minorities | ||||||
| All Whites | Racial Conservatives | Racial Moderates | Racial Liberals | |||
| GOP | Indep. | Dem | ||||
| Agree | 30.8% | 0.0% | 19.1% | 11.7% | 44.0% | 100% |
| Uncertain | 17.6% | 0.0% | 24.5% | 35.2% | 31.2% | 0.0% |
| Disagree | 51.6% | 100% | 56.4% | 53.1% | 24.8% | 0.0% |
| 4. BLM: I support the Black Lives Matter movement | ||||||
| All Whites | Racial Conservatives | Racial Moderates | Racial Liberals | |||
| GOP | Indep. | Dem | ||||
| Agree | 37.7% | 0.0% | 8.5% | 28.9% | 69.7% | 100% |
| Uncertain | 10.6% | 0.0% | 6.4% | 28.9% | 16.5% | 0.0% |
| Disagree | 51.6% | 100% | 85.1% | 42.2% | 13.8% | 0.0% |
| 5. White Privilege: I think white people in the U.S. have certain advantages because of the color of their skin | ||||||
| All Whites | Racial Conservatives | Racial Moderates | Racial Liberals | |||
| GOP | Indep. | Dem | ||||
| Agree | 48.6% | 0.0% | 39.4% | 47.7% | 78.9% | 100% |
| Uncertain | 5.7% | 0.0% | 11.7% | 13.3% | 4.6% | 0.0% |
| Disagree | 45.7% | 100% | 48.9% | 39.1% | 16.5% | 0.0% |
| 6. Group Differences: Because all racial groups are equal in ability, all group differences in achievement are due to racism | ||||||
| All Whites | Racial Conservatives | Racial Moderates | Racial Liberals | |||
| GOP | Indep. | Dem | ||||
| Agree | 20.4% | 5.3% | 11.7% | 8.6% | 31.2% | 55.7% |
| Uncertain | 18.7% | 4.7% | 18.1% | 24.2% | 33.0% | 17.5% |
| Disagree | 60.9% | 90.0% | 70.2% | 67.2% | 35.8% | 26.8% |
| 7. Hate Speech: I think America should have “hate speech” laws that make racist statements illegal | ||||||
| All Whites | Racial Conservatives | Racial Moderates | Racial Liberals | |||
| GOP | Indep. | Dem | ||||
| Agree | 26.6% | 8.0% | 24.5% | 19.5% | 44.0% | 47.4% |
| Uncertain | 16.8% | 5.3% | 18.1% | 20.3% | 22.9% | 21.6% |
| Disagree | 56.6% | 86.7% | 57.4% | 60.2% | 33.0% | 30.9% |
| 8. Systemic Racism: I think systemic racism in America oppresses minorities independently of racist behavior by whites. | ||||||
| All Whites | Racial Conservatives | Racial Moderates | Racial Liberals | |||
| GOP | Indep. | Dem | ||||
| Agree | 39.1% | 4.7% | 14.9% | 36.7% | 62.4% | 92.8% |
| Uncertain | 18.3% | 9.3% | 25.5% | 28.1% | 25.7% | 4.1% |
| Disagree | 42.6% | 86.0% | 59.6% | 35.2% | 11.9% | 3.1% |
| 9. Secession: America’s political divide is becoming so great that we may be better off allowing some states to secede and go their own way. | ||||||
| All Whites | Racial Conservatives | Racial Moderates | Racial Liberals | |||
| GOP | Indep. | Dem | ||||
| Agree | 28.7% | 46.7% | 33.0% | 24.2% | 17.4% | 15.5% |
| Uncertain | 18.2% | 15.3% | 21.3% | 25.8% | 19.3% | 8.2% |
| Disagree | 53.1% | 38.0% | 45.7% | 50.0% | 63.3% | 76.3% |
| 10. Diversity: A diverse America where most of the population are racial minorities will be good for the nation | ||||||
| All Whites | Racial Conservatives | Racial Moderates | Racial Liberals | |||
| GOP | Indep. | Dem | ||||
| Agree | 41.7% | 6.7% | 26.6% | 39.8% | 61.5% | 90.7% |
| Uncertain | 33.2% | 38.7% | 37.2% | 43.3% | 31.2% | 9.3% |
| Disagree | 25.1% | 54.7% | 36.2% | 16.4% | 7.3% | 0.0% |
Other political issues
These are the other questions we asked to fill out the lists for the list experiments. They are not the issues we cared about most, but the replies are still interesting. Racial conservatives have views that both echo and differ from those of Republicans in sometimes surprising ways. Why, for example, are racial conservatives more likely than generic Republicans to want to spend more money on Head Start?
Covid
| 1. Masks: I believe that everyone should wear masks to reduce the spread of the Covid virus. | ||||||
| All Whites | Racial Conservatives | Racial Moderates | Racial Liberals | |||
| GOP | Indep. | Dem | ||||
| Agree | 58.5% | 25.3% | 45.7% | 54.7% | 87.2% | 94.8% |
| Uncertain | 7.3% | 6.7% | 6.4% | 12.5% | 6.4% | 3.1% |
| Disagree | 34.3% | 68.0% | 47.9% | 32.8% | 6.4% | 2.1% |
| % of Sample | 100% | 26.0% | 16.3% | 22.1% | 18.9% | 16.8% |
Crime
| 2. Death Penalty: I support the death penalty for those convicted of murder | ||||||
| All Whites | Racial Conservatives | Racial Moderates | Racial Liberals | |||
| GOP | Indep. | Dem | ||||
| Agree | 51.7% | 78.0% | 67.0% | 50.0% | 35.8% | 16.5% |
| Uncertain | 17.3% | 11.3% | 10.6% | 24.2% | 31.2% | 8.2% |
| Disagree | 31.0% | 10.7% | 22.3% | 25.8% | 33.0% | 75.3% |
| 3. Police Funding: I think we should increase funding for the police | ||||||
| All Whites | Racial Conservatives | Racial Moderates | Racial Liberals | |||
| GOP | Indep. | Dem | ||||
| Agree | 49.5% | 77.3% | 83.0% | 37.5% | 27.5% | 14.4% |
| Uncertain | 15.1% | 9.3% | 4.3% | 27.3% | 22.0% | 10.3% |
| Disagree | 35.5% | 13.3% | 12.8% | 35.2% | 50.5% | 75.3% |
| 4. Criminal Sentences: I think tougher criminal sentences are needed to deter crime | ||||||
| All Whites | Racial Conservatives | Racial Moderates | Racial Liberals | |||
| GOP | Indep. | Dem | ||||
| Agree | 46.9% | 70.0% | 67.0% | 41.4% | 33.9% | 13.4% |
| Uncertain | 17.8% | 12.0% | 16.0% | 24.2% | 22.0% | 15.5% |
| Disagree | 35.3% | 18.0% | 17.0% | 34.4% | 44.0% | 71.1% |
| 5. Gun Control: I oppose gun control | ||||||
| All Whites | Racial Conservatives | Racial Moderates | Racial Liberals | |||
| GOP | Indep. | Dem | ||||
| Agree | 37.0% | 75.3% | 51.1% | 31.3% | 8.3% | 4.1% |
| Uncertain | 7.3% | 2.0% | 10.6% | 16.4% | 4.6% | 3.1% |
| Disagree | 55.7% | 22.7% | 38.3% | 52.3% | 87.2% | 92.8% |
Education
| 6. K-12 Education: I think we should spend more money on K-12 education | ||||||
| All Whites | Racial Conservatives | Racial Moderates | Racial Liberals | |||
| GOP | Indep. | Dem | ||||
| Agree | 62.8% | 42.7% | 52.1% | 59.7% | 76.1% | 93.8% |
| Uncertain | 10.6% | 6.0% | 16.0% | 16.4% | 11.9% | 3.1% |
| Disagree | 26.6% | 51.3% | 31.9% | 24.2% | 11.9% | 3.1% |
| 7. Head Start: More money should be spent on Head Start to make sure all children enter school ready to learn | ||||||
| All Whites | Racial Conservatives | Racial Moderates | Racial Liberals | |||
| GOP | Indep. | Dem | ||||
| Agree | 61.6% | 38.0% | 24.5% | 19.5% | 44.0% | 47.4% |
| Uncertain | 15.2% | 19.3% | 18.1% | 20.3% | 22.9% | 21.6% |
| Disagree | 23.2% | 42.7% | 57.4% | 60.2% | 33.0% | 30.9% |
| 8. School Choice: I support private school choice programs that would allow parents to send their children to private schools instead of public schools | ||||||
| All Whites | Racial Conservatives | Racial Moderates | Racial Liberals | |||
| GOP | Indep. | Dem | ||||
| Agree | 67.6% | 84.7% | 84.0% | 67.2% | 54.1% | 41.2% |
| Uncertain | 14.5% | 5.3% | 9.6% | 18.8% | 22.0% | 19.8% |
| Disagree | 17.8% | 10.0% | 6.4% | 14.1% | 23.9% | 39.2% |
| 9. Home Schooling: I think Americans should have the right to homeschool their children | ||||||
| All Whites | Racial Conservatives | Racial Moderates | Racial Liberals | |||
| GOP | Indep. | Dem | ||||
| Agree | 88.9% | 96.7% | 97.9% | 89.1% | 81.7% | 76.3% |
| Uncertain | 6.7% | 1.3% | 1.1% | 9.4% | 9.2% | 14.4% |
| Disagree | 4.3% | 2.0% | 1.1% | 1.6% | 9.2% | 9.3% |
| 10. Community College: I think community colleges should be tuition-free for everyone | ||||||
| All Whites | Racial Conservatives | Racial Moderates | Racial Liberals | |||
| GOP | Indep. | Dem | ||||
| Agree | 54.2% | 28.0% | 28.7% | 53.1% | 82.6% | 88.7% |
| Uncertain | 11.1% | 8.0% | 18.1% | 14.1% | 9.2% | 7.2% |
| Disagree | 34.8% | 64.0% | 53.2% | 32.8% | 8.3% | 4.1% |
Environment
| 11. Global Warming: I think there is not enough scientific evidence to prove that global warming is real | ||||||
| All Whites | Racial Conservatives | Racial Moderates | Racial Liberals | |||
| GOP | Indep. | Dem | ||||
| Agree | 28.7% | 53.3% | 29.8% | 22.7% | 15.6% | 12.4% |
| Uncertain | 10.4% | 8.7% | 28.7% | 12.5% | 0.9% | 3.1% |
| Disagree | 60.9% | 38.0% | 41.5% | 64.8% | 83.5% | 84.5% |
| 12. Wind & Solar Power: I think we should reduce our reliance on fossil fuels by increasing our use of wind turbines and solar power | ||||||
| All Whites | Racial Conservatives | Racial Moderates | Racial Liberals | |||
| GOP | Indep. | Dem | ||||
| Agree | 70.1% | 40.7% | 55.3% | 72.7% | 94.5% | 99.0% |
| Uncertain | 11.4% | 15.3% | 21.3% | 14.1% | 4.6% | 0.0% |
| Disagree | 18.5% | 44.0% | 23.4% | 13.3% | 0.9% | 1.0% |
| 13. Fuel Efficiency: Auto companies should be required to raise the fuel efficiency of cars | ||||||
| All Whites | Racial Conservatives | Racial Moderates | Racial Liberals | |||
| GOP | Indep. | Dem | ||||
| Agree | 60.2% | 33.3% | 48.9% | 56.3% | 80.7% | 94.8% |
| Uncertain | 13.3% | 12.7% | 20.2% | 19.5% | 11.0% | 2.1% |
| Disagree | 26.5% | 54.0% | 30.9% | 24.2% | 8.3% | 3.1% |
| 14. Clean Air Act: We should strengthen enforcement of the Clean Air Act | ||||||
| All Whites | Racial Conservatives | Racial Moderates | Racial Liberals | |||
| GOP | Indep. | Dem | ||||
| Agree | 61.4% | 26.7% | 42.6% | 65.5% | 89.9% | 95.9% |
| Uncertain | 13.8% | 18.0% | 23.4% | 15.6% | 9.2% | 1.0% |
| Disagree | 24.7% | 55.3% | 34.0% | 18.8% | 0.9% | 3.1% |
| 15. Clean Water Act: I think we should strengthen enforcement of the Clean Water Act | ||||||
| All Whites | Racial Conservatives | Racial Moderates | Racial Liberals | |||
| GOP | Indep. | Dem | ||||
| Agree | 68.5% | 42.7% | 50.0% | 71.9% | 90.8% | 96.9% |
| Uncertain | 15.7% | 23.3% | 28.7% | 15.6% | 7.3% | 1.0% |
| Disagree | 15.7% | 34.0% | 21.3% | 12.5% | 1.8% | 2.1% |
| 16. Nuclear Power: I oppose the expansion of nuclear power | ||||||
| All Whites | Racial Conservatives | Racial Moderates | Racial Liberals | |||
| GOP | Indep. | Dem | ||||
| Agree | 32.5% | 29.3% | 21.3% | 28.1% | 42.2% | 43.3% |
| Uncertain | 24.7% | 17.3% | 30.9% | 27.3% | 31.2% | 19.6% |
| Disagree | 42.7% | 53.3% | 47.9% | 44.5% | 26.6% | 37.1% |
| 17. Endangered Species: We should do more to protect endangered species | ||||||
| All Whites | Racial Conservatives | Racial Moderates | Racial Liberals | |||
| GOP | Indep. | Dem | ||||
| Agree | 80.1% | 61.3% | 69.1% | 84.4% | 94.5% | 97.9% |
| Uncertain | 9.2% | 16.0% | 16.0% | 8.6% | 1.8% | 1.0% |
| Disagree | 10.7% | 22.7% | 14.9% | 7.0% | 3.7% | 1.0% |
| 18. Recycling: I think recycling should be mandatory | ||||||
| All Whites | Racial Conservatives | Racial Moderates | Racial Liberals | |||
| GOP | Indep. | Dem | ||||
| Agree | 54.8% | 31.3% | 40.4% | 55.5% | 69.7% | 87.6% |
| Uncertain | 10.6% | 8.7% | 11.7% | 13.3% | 13.8% | 5.2% |
| Disagree | 34.6% | 60.0% | 47.9% | 31.3% | 16.5% | 7.2% |
Fiscal Policy / Size of Government
| 19. Spending Cuts: We should balance the federal budget with an across-the-board spending cut for all federal spending programs | ||||||
| All Whites | Racial Conservatives | Racial Moderates | Racial Liberals | |||
| GOP | Indep. | Dem | ||||
| Agree | 46.7% | 73.3% | 69.1% | 43.8% | 23.9% | 13.4% |
| Uncertain | 21.1% | 14.7% | 12.8% | 34.4% | 23.9% | 18.6% |
| Disagree | 32.2% | 12.0% | 18.1% | 21.9% | 52.3% | 68.0% |
| 20. Reduce Taxes: I think taxes should be reduced for everyone by 10% | ||||||
| All Whites | Racial Conservatives | Racial Moderates | Racial Liberals | |||
| GOP | Indep. | Dem | ||||
| Agree | 42.7% | 67.3% | 62.8% | 35.2% | 25.7% | 14.1% |
| Uncertain | 18.5% | 12.7% | 18.1% | 28.9% | 20.2% | 12.4% |
| Disagree | 38.8% | 20.0% | 19.1% | 35.9% | 54.1% | 73.2% |
| 21. Inheritance Taxes: We should repeal all inheritance taxes | ||||||
| All Whites | Racial Conservatives | Racial Moderates | Racial Liberals | |||
| GOP | Indep. | Dem | ||||
| Agree | 47.1% | 74.7% | 56.4% | 44.5% | 23.9% | 24.7% |
| Uncertain | 25.1% | 13.3% | 26.6% | 31.3% | 36.7% | 20.6% |
| Disagree | 27.9% | 12.0% | 17.0% | 24.2% | 39.4% | 54.6% |
| 22. Flat Tax: We should replace our current tax code with a flat tax where everyone pays the same tax rate | ||||||
| All Whites | Racial Conservatives | Racial Moderates | Racial Liberals | |||
| GOP | Indep. | Dem | ||||
| Agree | 30.1% | 46.7% | 34.0% | 32.0% | 11.0% | 19.6% |
| Uncertain | 18.5% | 18.0% | 22.3% | 22.7% | 18.3% | 10.3% |
| Disagree | 51.4% | 35.3% | 43.6% | 45.3% | 70.6% | 70.1% |
| 23. Reduce Regulations: I think Congress should cut the number of regulations by at least half | ||||||
| All Whites | Racial Conservatives | Racial Moderates | Racial Liberals | |||
| GOP | Indep. | Dem | ||||
| Agree | 34.1% | 66.7% | 44.7% | 29.7% | 10.1% | 6.2% |
| Uncertain | 32.7% | 21.3% | 38.3% | 47.7% | 35.8% | 21.6% |
| Disagree | 33.2% | 12.0% | 17.0% | 22.7% | 54.1% | 72.2% |
Foreign Policy
| 24. Afghanistan: I think American soldiers have been in Afghanistan for too long | ||||||
| All Whites | Racial Conservatives | Racial Moderates | Racial Liberals | |||
| GOP | Indep. | Dem | ||||
| Agree | 81.3% | 84.0% | 74.5% | 85.2% | 72.5% | 88.7% |
| Uncertain | 14.4% | 10.7% | 20.2% | 13.2% | 21.1% | 8.2% |
| Disagree | 4.3% | 5.3% | 5.3% | 1.6% | 6.4% | 3.1% |
| 25. China Tariffs: We should consider tariffs to address persistent trade imbalances with China | ||||||
| All Whites | Racial Conservatives | Racial Moderates | Racial Liberals | |||
| GOP | Indep. | Dem | ||||
| Agree | 55.4% | 80.7% | 64.9% | 46.1% | 39.4% | 37.1% |
| Uncertain | 29.9% | 12.0% | 26.6% | 35.2% | 45.0% | 37.1% |
| Disagree | 14.7% | 7.3% | 8.5% | 18.8% | 15.6% | 25.8% |
Healthcare
| 26. More Political Parties: I think America would be better off if there were more major political parties | ||||||
| All Whites | Racial Conservatives | Racial Moderates | Racial Liberals | |||
| GOP | Indep. | Dem | ||||
| Agree | 48.3% | 42.0% | 33.0% | 53.9% | 54.1% | 58.8% |
| Uncertain | 24.4% | 26.0% | 25.5% | 25.8% | 23.9% | 19.6% |
| Disagree | 27.3% | 32.0% | 41.5% | 20.3% | 22.0% | 21.6% |
| 27. Term Limits: I support term limits that would limit members of Congress to 12 years in office | ||||||
| All Whites | Racial Conservatives | Racial Moderates | Racial Liberals | |||
| GOP | Indep. | Dem | ||||
| Agree | 83.0% | 92.0% | 89.4% | 75.0% | 79.8% | 77.3% |
| Uncertain | 8.3% | 3.3% | 3.2% | 12.5% | 11.9% | 11.3% |
| Disagree | 8.7% | 4.7% | 7.4% | 12.5% | 8.3% | 11.3% |
Healthcare
| 28. Repeal Obamacare: We should repeal Obamacare (also known as the Affordable Care Act) | ||||||
| All Whites | Racial Conservatives | Racial Moderates | Racial Liberals | |||
| GOP | Indep. | Dem | ||||
| Agree | 40.3% | 76.7% | 70.2% | 31.3% | 7.3% | 4.1% |
| Uncertain | 15.1% | 10.0% | 12.8% | 36.7% | 7.3% | 5.2% |
| Disagree | 44.6% | 13.3% | 17.0% | 32.0% | 85.3% | 90.7% |
| 29. Medicare for All: We should enact a Medicare for All program that provides health insurance to all Americans | ||||||
| All Whites | Racial Conservatives | Racial Moderates | Racial Liberals | |||
| GOP | Indep. | Dem | ||||
| Agree | 49.7% | 14.7% | 22.3% | 50.8% | 80.7% | 93.8% |
| Uncertain | 14.2% | 15.3% | 19.1% | 18.8% | 12.8% | 3.1% |
| Disagree | 36.2% | 70.0% | 58.5% | 30.5% | 6.4% | 3.1% |
Poverty
| 30. Minimum Wage: We should raise the minimum wage | ||||||
| All Whites | Racial Conservatives | Racial Moderates | Racial Liberals | |||
| GOP | Indep. | Dem | ||||
| Agree | 60.7% | 28.7% | 38.3% | 60.9% | 92.7% | 95.9% |
| Uncertain | 9.9% | 14.7% | 17.0% | 8.6% | 4.6% | 3.1% |
| Disagree | 29.4% | 56.7% | 44.7% | 30.5% | 2.8% | 1.0% |
Social Issues
| 31. Abortion 1: All abortions should be illegal | ||||||
| All Whites | Racial Conservatives | Racial Moderates | Racial Liberals | |||
| GOP | Indep. | Dem | ||||
| Agree | 21.6% | 40.7% | 35.1% | 13.3% | 8.3% | 5.2% |
| Uncertain | 8.1% | 8.7% | 11.7% | 10.9% | 7.3% | 1.0% |
| Disagree | 70.2% | 50.7% | 53.2% | 75.8% | 84.4% | 93.8% |
| 32. Abortion 2: Abortions should be prohibited after the 20th week of pregnancy | ||||||
| All Whites | Racial Conservatives | Racial Moderates | Racial Liberals | |||
| GOP | Indep. | Dem | ||||
| Agree | 52.4% | 82.0% | 77.7% | 40.6% | 33.9% | 18.6% |
| Uncertain | 17.3% | 8.7% | 12.8% | 25.8% | 24.8% | 15.5% |
| Disagree | 30.3% | 9.3% | 9.6% | 33.6% | 41.3% | 66.0% |
| 33. Pornography: Pornography on the Internet should be banned | ||||||
| All Whites | Racial Conservatives | Racial Moderates | Racial Liberals | |||
| GOP | Indep. | Dem | ||||
| Agree | 28.0% | 33.3% | 44.7% | 18.0% | 27.5% | 17.5% |
| Uncertain | 13.5% | 14.7% | 8.5% | 15.6% | 14.7% | 12.4% |
| Disagree | 58.5% | 52.0% | 46.8% | 66.4% | 57.8% | 70.1% |
Social Programs
| 34. Social Security: We may need to reduce Social Security benefits to ensure the long-term financial stability of the program | ||||||
| All Whites | Racial Conservatives | Racial Moderates | Racial Liberals | |||
| GOP | Indep. | Dem | ||||
| Agree | 12.8% | 16.0% | 10.6% | 18.8% | 11.9% | 3.1% |
| Uncertain | 14.9% | 10.0% | 14.9% | 28.1% | 11.9% | 8.2% |
| Disagree | 72.3% | 74.0% | 74.5% | 53.1% | 76.1% | 88.7% |
| 35. Assistive Technology: We should spend more money on assistive technology for senior citizens | ||||||
| All Whites | Racial Conservatives | Racial Moderates | Racial Liberals | |||
| GOP | Indep. | Dem | ||||
| Agree | 62.1% | 46.7% | 55.3% | 53.1% | 77.1% | 87.6% |
| Uncertain | 18.2% | 19.3% | 24.5% | 22.7% | 13.8% | 9.3% |
| Disagree | 19.7% | 34.0% | 20.2% | 24.2% | 9.2% | 3.1% |
| 36. Job Training: We should spend more money on job training programs for teenagers | ||||||
| All Whites | Racial Conservatives | Racial Moderates | Racial Liberals | |||
| GOP | Indep. | Dem | ||||
| Agree | 74.2% | 62.0% | 71.3% | 70.3% | 80.7% | 93.8% |
| Uncertain | 10.6% | 10.7% | 13.8% | 11.7% | 10.1% | 6.2% |
| Disagree | 15.2% | 27.3% | 14.9% | 18.0% | 9.2% | 0.0% |
[1] The age breakout in this poll includes slightly fewer whites aged 18-29 (lower by 2.8%) and whites aged 65 and older (lower by 6.5%) than is true of the American white population. These two age groups are harder to reach online. The average age of the sample is still representative of whites nationally.
[2] High school graduates are underrepresented by 10 percent in this sample. As above, this is a harder group to reach online. “Some college” and college graduates are slightly over represented in this sample.
[3] Racial conservatives are defined as whites who take the racially conservative position on all four of these racial questions: immigration, affirmative action, BLM support, and white privilege (for wording of the questions, see the next section). Racial liberals take the racially liberal position on all four of those questions. All other whites are defined as racial moderates.


