Why is There Inequality?
Jared Taylor, American Renaissance, September 2008
Richard Lynn, The Global Bell Curve, Washington Summit Publishers, 2008, 360 pp.
Richard Lynn, emeritus of the University of Ulster, continues his astonishingly productive work in the field of race and IQ with the publication of his fourth book in the field, The Global Bell Curve. In earlier books, such as IQ and Global Inequality, Prof. Lynn discussed the national and regional consequences of population differences in intelligence. In The Global Bell Curve he concentrates on what these differences mean for multi-racial societies. In a systematic treatment of virtually every country with significant racial minorities, he has found the same socioeconomic hierarchy Richard Herrnstein and Charles Murray found in their 1994 study of the United States, The Bell Curve: whites and Asians at the top, with other races following in consistent order.

What causes this hierarchy? Prof. Lynn is perhaps the first scholar to take a single explanation — group differences in IQ — and apply it rigorously to all major multi-racial societies. He has thus established what might be called a general theory of inequality and tested it in dozens of countries. The results are clear: Groups differ in average IQs, and it is this that largely determines their success or failure, wherever they are and whatever their circumstances.
Out of India
There are several population groups that have been scattered around the world — whites, Jews, Africans, Chinese — and scholars have often commented on how consistently these peoples either rise to the top or sink to the bottom in multi-racial societies. It is less well known that Indians can be studied in the same way.
In modern times, there have been substantial Indian populations in Kenya, Uganda, Tanzania, Mozambique, Zambia, Zimbabwe, and South Africa. There are Indians in Malaysia, Indonesia, Fiji, throughout the Caribbean, and in parts of South America. As Prof. Lynn notes, they have a consistent pattern of mid-level achievement that is entirely consistent with their mid-level average IQ.
How did Indians get to all these places? In almost every case, white colonizers brought them when free blacks (or other local populations) were unwilling to do the work slaves had done. In the Caribbean, for example, former slaves disappeared into the back country and became subsistence farmers rather than work for wages at their old jobs. The only way to get the harvests in was to import a new work force.
In Africa itself, white colonists did not arrive in large numbers until after abolition, so there was never a tradition of plantation slave labor. But here, too, blacks were content to live at subsistence level rather than work for wages on railroads or plantations. As Sir Harry Johnston, a British colonial administrator in Natal, noted, the black man “has, as a rule, a strong aversion to continuous agricultural labor . . . Though they made useful domestic servants and police, [they] were of but little use in the plantations.”
As a British member of parliament, Herbert Samuel, pointed out in 1902: “The progress of these portions of Africa would have been slow indeed, had it not been possible to draw upon our Asiatic possessions for unlimited supplies of subordinate labor . . .” The Portuguese, Dutch, and Germans also replaced unreliable native labor by importing Indians. The result was a host of complex, multi-racial societies from which Prof. Lynn has drawn useful conclusions.
All across Africa the pattern is the same. Although Indians arrived as impoverished indentured laborers, they very quickly moved ahead of Africans and became traders and bureaucrats. In several British colonies, white administrators responded to black resentment by making special efforts to recruit black officials, but went back to hiring Indians because the differences in ability were so great. In Kenya in the 1920s, the British worried that Indians were dominating the economy, and set up preference programs for public contracting. Again, blacks could not do the work, forcing the British to rely on Indians. The retail trade was almost entirely in Indian hands.
Prof. Lynn quotes sociologists Floyd and Lillian Dotson’s 1960s explanation for why blacks did not open shops:
[T]his demands a knowledge of arithmetic and bookkeeping which would be completely beyond the average African. He does not know prices or where to buy stock advantageously. He does not know in detail what each item costs him, and he doesn’t bother to figure out a fixed mark-up, item by item. For this reason, he often sells at a loss without realizing what he is doing.
The Dotsons added that blacks often thought sales revenue was pure profit and did not realize most of it had to be reinvested in new inventory.
Prof. Lynn notes that by 1971, 90 percent of the Indians in Tanzania were in white collar or at least semi-skilled jobs, whereas the figure for blacks was only 40 percent. Wherever statistics are available, Prof. Lynn shows that there is a strict racial hierarchy in terms of income, poverty, illegitimacy, and crime, with Indians invariably more successful than blacks. These outcomes are entirely consistent with an average IQ for Indians in Africa of about 87 as opposed to an African average of approximately 70. Indians have an IQ advantage over Africans as great as the advantage of whites over blacks in the United States.
In South Africa, there is another racial ingredient in the form of “coloreds,” who are a white-black mix. Their performance is similar to that of Indians, and is midway between that of blacks and whites. In all these societies, Prof. Lynn has found a negative correlation between average IQ and fertility, with the less intelligent groups reproducing more successfully than the more intelligent.
Racial hierarchies in the Caribbean islands fit the same pattern. When freed black slaves refused to do agricultural work, desperate planters brought in Indians, Chinese, and even a few Portuguese. Many of the islands therefore have five racial groups: whites, blacks, mulattos, Indians, and Chinese. In the 19th century, the British novelist Anthony Trollope visited the islands and noted bluntly that “the Chinese and the Coolies (Indians) greatly excel the Negro in intelligence.” After a visit to Guyana on the South American mainland he concluded: “The Coolies (Indians) and the Chinamen have an aptitude for putting money together . . . the Negroes as a class do not have this aptitude, consequently they lie in the sun and eat yams.”
Throughout the islands, Chinese have done extremely well, often exceeding whites in income and socioeconomic status, and having the lowest crime and fertility rates. Mulattos do not do as well as whites or Chinese but consistently make more money and commit fewer crimes than blacks.
Cuba, with a population that is 37 percent white, 51 percent mulatto, and 11 percent black, is an instructive case because the Castro revolution has strenuously fought for racial equality. It has not succeeded. Elites remain overwhelmingly white, and in 1994 blacks and mulattos rioted for better treatment. A government survey in 1995 found that 58 percent of whites thought blacks were less intelligent than whites, 69 percent thought them lacking in “decency,” and 68 said they opposed miscegenation.
Haiti, by far the poorest country in the Western hemisphere, is 95 percent black and 5 percent mulatto. Prof. Lynn reports that “nothing is known of the intelligence of the population of Haiti,” but it is not hard to guess. The Dominican Republic, which shares the island of Hispaniola, is 16 percent white, 73 percent mulatto, and 11 percent black, and has three times the per capita income of Haiti. In Haiti, the ruling class is mulatto; in the Dominican Republic, it is white.
Overseas Chinese
In Southeast Asia, it is the “Overseas Chinese” who offer the most interesting study of consistent racial differences in achievement. Chinese began moving into the area in the 19th century, and immediately gained a reputation for competence and industriousness, bringing commerce and urban life to many areas that had little of either. When the Spanish decided to make the Philippines as profitable as possible, they encouraged Chinese immigration. In 1914, King Rama VI of Thailand called Chinese “the Jews of the East.”
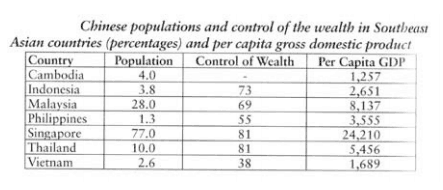
Prof. Lynn concludes from the available testing data that Chinese in Southeast Asia have IQs of 105 to 107 — slightly higher than the Chinese average — suggesting some self-selection for emigration. High intelligence has given them a great advantage over the native populations. Indonesians, for example, have an estimated average IQ of 87 to 89, and as the table below shows, Chinese dominate the economies of the regions. Prof. Lynn concludes that the higher the percentage of Chinese in the population, the higher the standard of living.
Local people resent Chinese success. When Indonesia became independent from Holland in 1949, founding president Sukarno (like many Javanese, he had only one name) established a socialist system, partly because he feared there would be no way to control the Chinese in a free-market economy. Chinese took over much of the economy anyway, and in 1965 to 1966 there were mass killings of Chinese, often with government encouragement. There were more attacks in 1974 and 1998. Since 1982, Indonesia has had quota systems that are supposed to level inequalities in education and wealth but have not had much effect.
Malaysia had serious anti-Chinese riots in Kuala Lumpur from May to July 1969, which led the government to declare a state of national emergency. The official death toll was 196, but journalists and others cite figures ten times higher. The resentment against Chinese dominance that fueled the riots led to a series of very aggressive preference programs for Malays called the New Economic Policy. There are even different standards of university grading for Malays so their grades are no lower than those of Chinese students.
About 8 percent of the Malaysian population is Indian, and preference policies work against them, too. Prof. Lynn notes that with average IQs in the upper 80s, they have no advantage over the Malays, but seem to work harder and are moderately more successful.
Singapore became heavily Chinese because the British found that Malays were unreliable workers and imported Chinese to take their places. (In like manner, Chinese and Japanese were encouraged to migrate to Hawaii because Hawaiians would not work in commercial agriculture.) Lee Kwan Yew, who led Singapore to independence and was prime minister from 1959 to 1990, has stated bluntly that there are racial differences in learning ability and that Malays simply cannot compete with Chinese. Prof. Lynn agrees, noting that the Chinese have a 15 to 16 point advantage in average IQ. Mr. Lee also caused a stir by publicly denouncing the sharp dysgenic fertility in both Chinese and Malays. He set up incentives for college-educated Singaporean women to marry and have children, but lifetime fertility in Singapore, now at 1.08 child per woman, is so low that he extended incentives to the whole population.
Prof. Lynn finds a consistent pattern throughout the region of Chinese outperforming the native population in terms of income, crime, poverty, illegitimacy, life expectancy, years of education, etc. In only one area are the lower-IQ groups more successful: they are more fertile than the Chinese.
Latin America
In Brazil, it is Japanese instead of Chinese who have established themselves as the elite minority. Japanese first came in 1908 at the encouragement of the government for the usual reason: Freed blacks — some three to four million Africans were shipped to Brazil as slaves — refused to do agricultural work. Brazil now has 1.25 million Japanese.
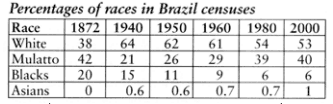
From 1872 until 1940 the government also had an official policy of encouraging immigration from Europe. As can be seen below, the white population reached a high of 64 percent in 1940, but whites are now slipping into minority status as the black population grows through natural increase. The percentage of mulattos has increased through black-mulatto intermarriage.
Although Brazilians have often claimed there is no racial tension in their country, it is very much a “pigmentocracy,” with whites and Asians at the top and blacks at the bottom. Lighter-skinned blacks disdain those with dark skin and try to live apart from them.
The military police in Rio de Janeiro and Sao Paolo have an unwritten policy of fighting street crime by shooting black criminals. In 1991, for example, there were 1,171 official killings of criminals by police in Sao Paolo and probably many more that were unreported. By contrast, that same year New York City police killed 27 people. In Rio, police go on unofficial night patrols to kill black and mulatto street children.
In Brazil, Japanese now outperform whites in income, years of education, and arrest rates. They also have the lowest fertility. Prof. Lynn notes that in one of the rare exceptions to general patterns, the fertility of Brazilian mulattos is higher than that of blacks.
The rest of Latin America is likewise a clear “pigmentocracy” with blacks at the bottom. As the British anthropologist Peter Wade wrote in 1997, “[S]tereotypes of blacks all over Latin America commonly include ideas about their supposed laziness, happy-go-lucky attitudes, disorganized family life, taste for music and dance, and so on . . .”
Like Brazil, several other countries, such as Argentina and Paraguay, encouraged Asian immigration. Peru now has 120,000 Chinese and 50,000 Japanese, who are at the top of the Peruvian social structure. Again, immigrants were to replace the labor of freed slaves (in Surinam the Dutch imported Indians, noting that the ex-slaves were “unmanageable and unreliable”).
Latin American countries vary greatly in the number of pure-blooded Amerindians in their populations — Bolivia has 55 percent, a majority; Argentina and Costa Rica have 1 percent or fewer. With an estimated average IQ of 87, Amerindians are second to or equal to blacks in poverty, crime rates, and fertility.
The West
The first five blacks arrived in Britain as slaves in 1555, and from the late 16th century and increasingly in the 17th and 18th centuries, it was fashionable for rich families to have one or two black slaves. They often wore iron collars to indicate their status. During the American Revolution, British forces encouraged slaves to run away, and several hundred ended up in London as beggars. This prompted the British to establish Sierra Leone as a resettlement site for freed slaves whither they expelled most of the American blacks.
Only after the Second World War did large numbers of non-whites arrive in Britain. In 1948, Clement Atlee’s government passed the British Nationality Act, which allowed imperial subjects to immigrate. Just weeks later, the first boatload of blacks arrived from Jamaica, and 10 years later there was the first British race riot in Notting Hill, London.
Although British blacks have only about 13 percent white ancestry as opposed to 25 percent for American blacks, they have about the same average IQ of 85 or 86. It is likely that those who manage to reach Britain are somewhat more intelligent than other Caribbean blacks.
Britain also has a large number of Indians, Pakistanis, and Bangladeshis, and at 92, there seems to be no difference in the average IQs of these groups. This is a higher figure than for the Asian home populations, and Prof. Lynn suspects it is the result of better nutrition and selective migration.
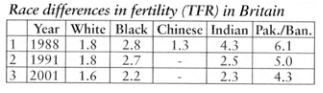
The highest-IQ population in Britain is Jews, with an average of 111, followed by Chinese at 103. The group hierarchy in terms of income, crime, poverty, school achievement, etc. is entirely as expected, in the order of Jews, Chinese, whites, South Asians, and blacks. Like American blacks, although they are at the bottom of society, British blacks report higher self-esteem than whites. Likewise, as in the United States, black women do relatively better than black men. As the table above shows, fertility by racial group in Britain is dysgenic.
In Australia, the aboriginals are a primitive people descended from New Guineans. From earliest contact, whites thought them unintelligent. One Briton described the native as “a nomad, who knows neither pottery nor metal work, has no domesticated animals, and he does not till the ground,” adding that “two or a pair represent the extent of the numerals.” Tasmanians were even more primitive. They are the only people thought never to have learned how to make fire. They never hafted a sharp stone onto a wooden handle to make a spear or ax. This low level of development reflects aboriginal IQ scores that average 62 to 66, the lowest figure for any human group.
Aboriginals have a murder rate 10 times that of whites, and aboriginal women are 45 times more likely than white women to be abused by their husbands. Aboriginals never discovered fermentation, and many became alcoholic after contact with the British.
Many aboriginals live in government-supported settlements. In the 1980s, the German sociologist Hans Schneider described the residents: “They have not accustomed themselves to garbage disposal with the result that the surrounding bush land is littered with old cans, bottles, tires, transistor radios, and batteries. Rusty car bodies and unauthorized garbage dumps can be seen everywhere . . . They just sit around in a state of boredom and hopelessness . . . Faulty machinery is simply left where it breaks down and transistor radios are thrown away when the batteries are flat.”
Interestingly, like blacks, aboriginals have high levels of self-esteem. Their fertility is well over four per woman, so despite high infant mortality and short life expectancy their population doubles every generation. By contrast, Chinese immigrants are outcompeting white Australians just as they have Southeast Asians. Differences in success rates have been so striking that in 1994 Lee Kwan Yew of Singapore predicted that Australians would become the poor white trash of Asia (see “The Australian Immigration Crisis,” AR, Jan. 2008).
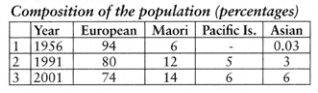
New Zealand was first discovered by the Dutch in 1642 and got its name from the Dutch province of Zeeland. The Maoris, who had been on the islands since perhaps 1000 AD, had no written language and most were hunter-gatherers. A few practiced slash-and-burn agriculture, but worked the land with simple sticks. They have a relatively high average IQ of 90, but a 1950s report found that “adolescents and adults alike tend to become demoralized, apathetic, and unwilling to take even the simplest steps to improve their lot.” Today, Maoris are at the bottom of society, with high rates of crime and poverty, though Maori women do better than Maori men.
As often happened after first contact with Europeans, the Maori population went into a steep decline, but stabilized in the 20th century. It is now growing steadily while whites fail to reproduce. As in Australia, the small but growing Asian population is overrepresented in the top schools and best-paying jobs.
In Canada, group differences in achievement fit the standard pattern. Although Jews first arrived between 1890 and 1914 as penniless refugees who spoke neither English nor French, by 1951 they had become the group with the highest incomes. The first Chinese came as laborers in 1858, but further arrivals were cut back by pro-European immigration policies that continued until 1962. Canadian immigration now operates according to a point system that is supposed to let in only productive immigrants, but many illegals and fake refugees abuse the system. Asians are the top-performing group after Jews.
Blacks have almost exactly the same social profile as in the United States and Britain. At 87, Amerindians have the same average IQ as in the rest of the Americas, and though they are not as violent as blacks they tend to be poorer. Their fertility rate is about twice that of the white rate of 1.8.
Prof. Lynn notes that French Canadians — for whom he can find no IQ data — have traditionally been poorer and less educated than English-speaking Canadians. They have sometimes complained of discrimination, but Prof. Lynn does not see how Quebeckers, as the majority population in a region that has always had considerable local control, can justify that claim. In any case, he notes that in recent years the achievement gap has narrowed.
The Global Bell Curve has a long chapter on group rankings in the United States, but there are no surprises here; American outcomes are consistent with the rest of the world.
Explanations
Needless to say, Prof. Lynn is not the first person to notice that different races achieve at different levels, nor is he the first to wonder why. However, the usual approach is to study inequality in a particular country, say Brazil, and then cobble together ad hoc explanations with names like “the culture of poverty” or “institutional racism.” In any society in which whites are at or near the top, “racism” is the inevitable explanation for why some groups do poorly.
These explanations may seem plausible in a limited context but fail completely as a general theory of group differences. How, for example, do the tiny populations of whites in some Caribbean islands — sometimes just 1 or 2 percent — manage to oppress huge majorities of blacks? Who established and runs the “institutional racism” that keeps the blacks of Haiti poor? How have Asians and Jews always managed to defeat white “racism” and climb to the top? When the British brought over Indian peasants to work the fields in Africa or the Caribbean they presumably had a “culture of poverty.” How did they shake it off? Why did they do so much better than Africans but not as well as whites? Most attempts to explain group differences in achievement never consider these questions, and no theory that ignores IQ can even begin to answer them.
The late Nigerian-American anthropologist, John Ogbu offered a slightly ambitious theory. He proposed that “voluntary minorities” do well while “involuntary minorities” do not. In other words, Chinese and Jews, who freely emigrated were successful, whereas blacks, who were forcibly transported, failed. Leaving aside whether Jews escaping pogroms were “voluntary minorities,” this theory doesn’t work. Mexicans are a voluntary minority in America but do not behave like Chinese or Jews. Blacks are a voluntary minority in Canada and Britain but behave like blacks. North Africans are a voluntary minority in France. Haitians were involuntary migrants to the Caribbean, but quickly became the ruling majority. Is there an Ogbu theory about “involuntary majorities” to explain why Haiti is such a mess?
As Prof. Lynn demonstrates, group traits are durable. Indeed, his approach to race in this book may seem more powerful to some readers than any accumulation of IQ scores, brain-size studies, theories about regression toward the mean, or definitions of psychometric g. There is something relentlessly convincing about examining a race or sub-group, whether it is Japanese, Chinese, Jews, blacks, Europeans, or Indians, and finding that wherever they are, whatever their circumstances, their achievements as a group are almost perfectly predicted by their average IQ.
Most people understand that behavior is a result of some combination of genes and environment. If groups always act the same no matter what the environment, it is very convincing evidence that genes explain why some outperform others. It is hard to imagine how anyone could get to the end of The Global Bell Curve and think otherwise.


