White-on-White Voting
Thomas B. Edsall, New York Times, November 16, 2017
{snip}
What is so interesting about this working-class community, with its strong ties to organized labor? It is one of thousands of white enclaves across the nation that provided Trump with his margin of victory.
The election of Donald Trump revealed that in some of the nation’s whitest municipalities and counties — the communities arguably most insulated from urban crime, immigration and gangs — Trump did far better than Romney had done four years earlier.
The 2016 results suggest that residents of a diminishing number of decisively white American towns and small cities — even those which supported Barack Obama in 2008 and 2012 — can now be politically mobilized around race, ethnicity, multiculturalism and immigration.
{snip}
Where are the overwhelmingly white localities experiencing the most rapid rate of minority population growth, although the absolute numbers themselves are small? They are in the part of the nation’s heartland — Wisconsin, Michigan, Ohio, and Pennsylvania — where Trump earned enough Electoral College support to win the presidency even as he lost the popular vote.
In that light, look more closely at Dravosburg [Penn.]. In 2000, according to the United States Census Bureau, 1,989 out of 2,015 residents — 98.7 percent — were white; 10 were black; and 12 were Hispanic. By 2016, the census reported, the total population had fallen to 1,746 — 95.4 percent of them white. The number of blacks and Hispanics, still tiny, had grown rapidly, however, to 39 (a 290 percent increase), and to 25 (a 108 percent increase).
Or take Elk County in Northwest Pennsylvania. In 2000, Elk had a population of 35,112, of whom 34,746, or 98.96 percent, were white. 62 residents were black and 142 were Hispanic. By 2016, Elk’s population had fallen to 30,480, 97.5 percent of whom were white. 152 were black and 244 were Hispanic, increases of 145 and 72 percent.
In 2008, Elk County residents voted 51-47 for Obama over McCain. In 2012, the county backed Romney over Obama 57-41. In 2016, Trump swept Elk County, 69-27.
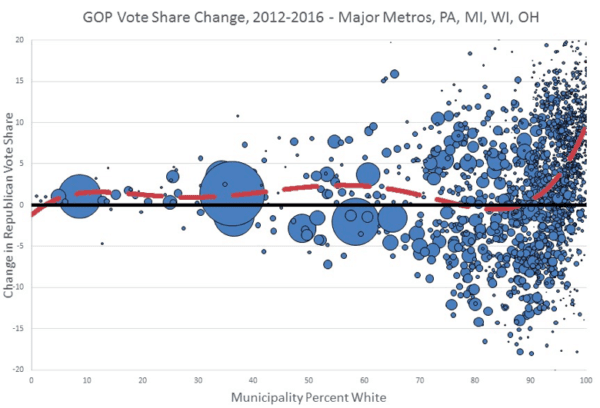
Dravosburg and Elk County are representative of the thousands of overwhelmingly white communities that shifted sharply to the right in 2016. This shift can be seen in the accompanying graphic, provided to The Times by Myron Orfield, a law professor at the University of Minnesota and director of the Institute on Metropolitan Opportunity there.
Trump trailed Romney in the majority of municipalities, just as he did in the national vote: Trump won 45.93 percent of the total vote last year, 1.2 percentage points less than Romney’s 47.1 percent in 2012 (third party candidates in 2016 picked up slightly more of the vote than they did in 2012). At the point when the percentage of whites in a municipality in the chart reaches 85 percent, Trump’s margin begins to soar, hitting its highest point in those municipalities that are close to (but not quite at) 100 percent white.
Will Stancil, a research fellow at the Institute on Metropolitan Opportunity who created the chart, explained to me in an email that nationally, Trump mostly lagged behind Romney. But in the limited selection of communities where his message hit home, it really hit home, with large gains over Romney really running up the score. These places were very heavily white.
{snip}
Trump’s vote skyrocketed in very white suburbs. In the more racially diverse suburbs, particularly those that had been diverse for more than a decade, the white vote for Trump did not increase over Romney’s vote. But in the very white suburbs, particularly in very segregated areas of the Midwest and Northeast, Trump’s vote jumped enormously over Romney’s.
{snip}
Orfield and Thomas Luce, research director at the Institute on Metropolitan Opportunity, reported in a 2013 paper, “America’s Racially Diverse Suburbs: Opportunities and Challenges,” that from 2000 to 2010, the percentage of suburbanites living in areas that were at least 60 percent white fell from 51 to 39 percent.
{snip}
“Fifty-six percent of the neighborhoods that were integrated in 1980 had become predominantly nonwhite by 2010,” Orfield and Luce wrote, “and only 40% of neighborhoods that were integrated in the 1980s remained in that category in 2010.”
Trump’s anti-immigrant, racially loaded messages resonated most powerfully among voters living in the least diverse, most racially isolated white communities. It is in these locales, which are experiencing the earliest signs of minority growth, that anxiety over approaching diversity is strongest.
{snip}
Orfield and Stancil’s work complements findings I reported on in a column last month that showed that Trump performed best in states and communities that were heavily white, but which had experienced relatively small increases in minority populations, notably from immigrants. While small in absolute numbers, the rate of growth represented by these increases was often exceptionally high: For example, if the nonwhite share of the population grew from 2 to 6 percent, the rate of growth was 200 percent.
{snip}
“Trump,” Alan Berube, deputy director of the Brookings Institution Metropolitan Policy Program, wrote in an email got a particular boost from small, overwhelmingly white communities threatened not only by real forces of technological change and trade, but also by the specter of immigrants and other nonwhites making gains at their expense in America’s economy and society.
As the accompanying graphic shows, in the four key Rust Belt states that handed Trump the presidency, the same pattern of voter mobilization in ultra-white districts emerges even more forcefully.
“To the extent Trump really resonated, it was in heavily-white areas — and that includes exurbs at the urban fringe, rural areas, and many heavily white second-ring suburbs,” Stancil wrote in his email. “It was his message resonating in those areas that gave him a fighting chance at all.”
{snip}
As the public discourse around issues of social welfare, immigration, national security, and a whole host of other issues becomes highly racialized and explicitly hostile, the potential for open racial conflict may rise. Furthermore, as these negative attitudes toward racial outgroups become increasingly tightly tied to parties, polarization increases and gridlock and a lack of legislative compromise ensue.
When I look back at the 2016 election, what is really striking is how much influence over the course of events was exercised by the relatively small numbers of voters in super-white municipalities and counties and by the politician who ignited them — how the last gasp of a small fraction of the electorate set the nation on such a dangerous and destructive course.
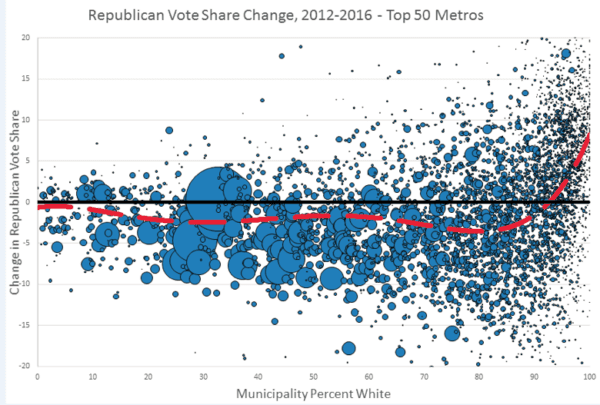
Left to right, the percentage of whites in every municipality within the nation’s top 50 metropolitan areas. The red line shows where Trump did less well than Romney and where he did much better.