UK Voters, Including Leavers, Care More About Reducing Non-EU Than EU Migration
. Simon Hix, Eric Kaufmann, and Thomas J. Leeper, London School of Economics, May 30, 2017
Brexit leaders such as Boris Johnson have maintained a narrative that sovereignty, not immigration, was the key motivation behind the Leave vote. Keen to distance themselves from charges of xenophobia, Vote Leave worked hard to dispel the notion that their cause was powered by generalised anti-immigration sentiment. Where immigration was mentioned, the issue, it was claimed, was not numbers but control and fairness. Why should unskilled East Europeans get in ahead of qualified South Asians? Leave leaders took pains to reach out to Britain’s Asian community: MPs Gisela Stuart and Priti Patel spoke of how hard it was for those from the Indian subcontinent to get visas while EU migrants were able to simply walk in. A significant minority of Asian voters, including the main curry chef association, returned the favour by backing Brexit.
Yet academic research raises questions over this interpretation. First of all, immigration was key. Using survey data, Harold Clarke, Paul Whiteley, and Matthew Goodwin show that immigration is by far the strongest predictor of a Leave vote, and anti-immigration folk were more motivated to show up at the polls than others. Meanwhile, Geoffrey Evans and Jon Mellon find that UKIP and Vote Leave were able to successfully link the immigration issue, which voters cared about, to the EU question, which they didn’t, generating the electricity needed to put Leave over the top.
Second, and more surprising, is concern over non-European immigration. The problem of unrestricted low-skill European immigration was repeatedly flagged during the campaign, so many assume people voted Leave because they were primarily exercised by the issue of East European immigration. This turns out not to be the case.
We tend to make emotional decisions and rationalise these to ourselves after the fact. American social psychologist Jon Haidt calls our emotions the ‘elephant’ and our cognition the ‘rider’. Daniel Kahneman and Amos Tversky prefer ‘fast’ and ‘slow’ thinking as the metaphor. Either way, our research shows that immigration in general – notably non-EU immigration – is the fast-thinking elephant behind the Leave vote.

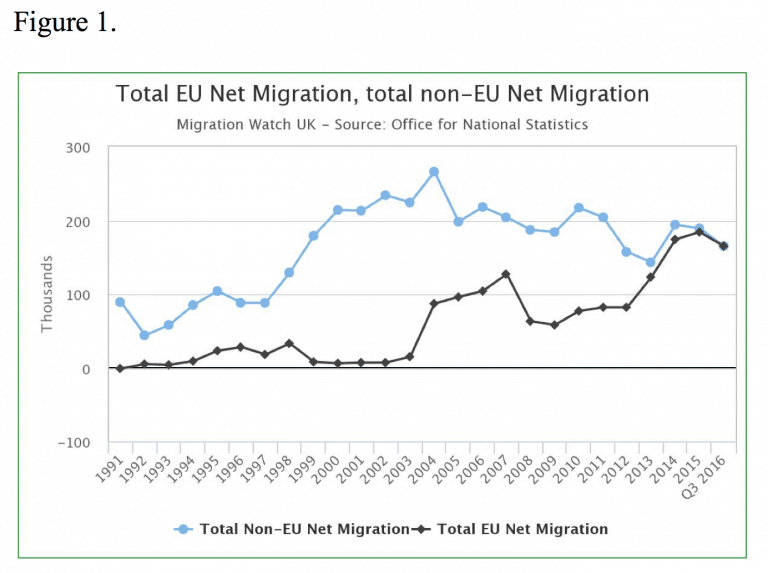
Over the past two decades, non-European immigration has usually exceeded European immigration as figure 1 shows. The share of non-European origin in the population of England and Wales doubled between 2001 and 2011. Yet openly appealing to anti-Asian or anti-African immigration sentiment was tricky due to its racial connotations. As Labour MP Frank Field relates: ‘The truth is, I wasn’t brave enough to raise it [immigration] as an issue – though I thought it was an issue for yonks – until we were talking about white people coming in. And even then the anger that this was racist was something one had to face.’
In order to assess the importance of non-European immigration we conducted a survey of 3,636 UK residents through YouGov’s online panel between 26 April and 3 May 2017. We asked respondents separate questions about EU and non-EU immigration, asking them to indicate their preferred level of net immigration of each group on a sliding scale from 0 (meaning no net immigration) to 165,000 (the then-current levels for each world region). (The full question is included at the end of this post).
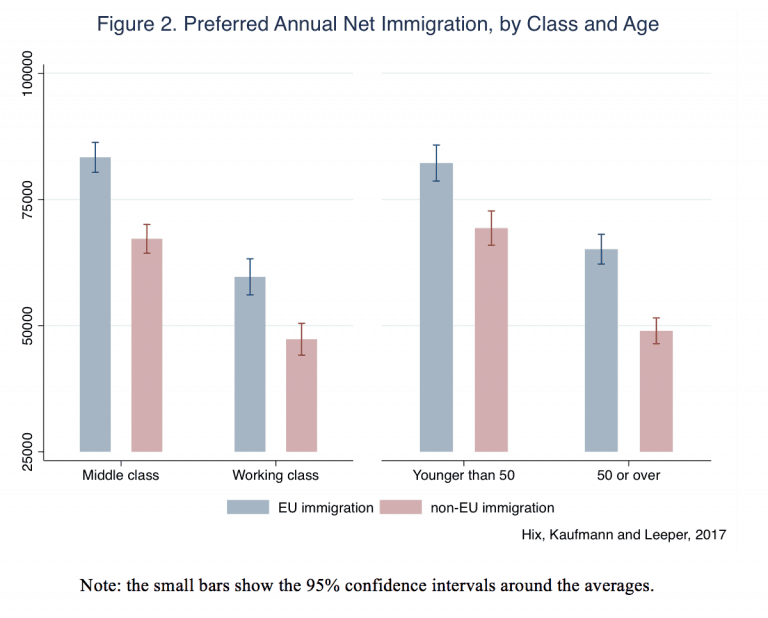
What’s striking – and no one is talking about – is that British voters prefer EU to non-EU migrants: the blue bars representing desired levels of European immigration are higher than the red bars for preferred levels of non-European immigration among all British voters. This pattern of preferring immigrants from inside the EU to those from outside holds across all social groups in our data. For example, figure 2 shows the patterns by social class and age. Middle class people (in ABC1 social grades) prefer more net immigration than working class people (in C2DE social grades), but both groups want fewer non-EU than EU immigrants. Similarly, younger people prefer more net immigration than older people, but, again, all want fewer non-EU than EU immigrants.

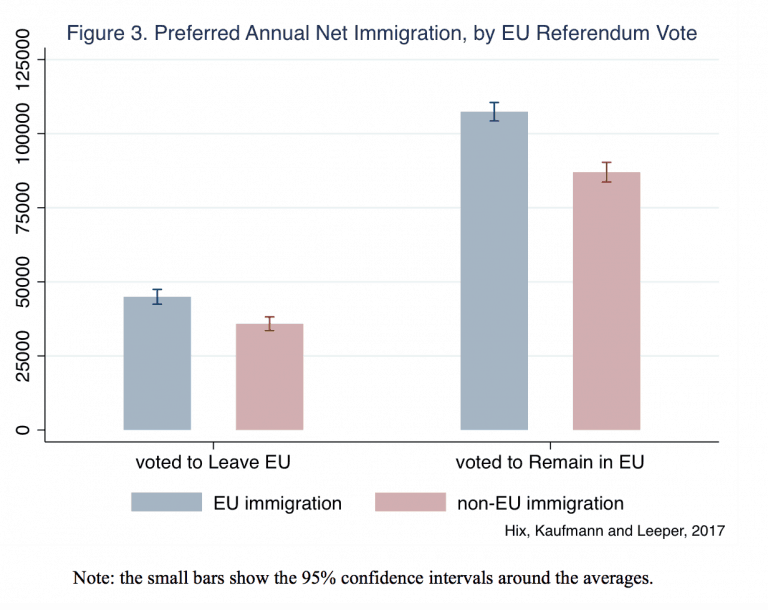
The same pattern holds for Leavers and Remainers, as shown in figure 3. But Leavers are much more motivated by the immigration issue than Remainers and seek far lower numbers. As figure 3 reveals, the average Leaver in our data wants non-European net migration reduced from about 165,000 in 2016 to 36,000. In other words, they are calling for a bigger cut in non-EU than EU inflows.

These findings echo those of a recent study showing that the increase in non-European (BAME) respondents in a White British person’s local area in the 2000s was a somewhat stronger predictor of their support for UKIP than the increase in local European population. This suggests that in the wake of the 2015 Migrant Crisis, the threat of unchecked non-European immigration, alluded to in Nigel Farage’s controversial ‘breaking point’ poster, may have motivated some Leave voters. A keen sense of these sentiments may also have informed the government’s recent decision to increase the Immigration Skills Charge and raise earnings thresholds for those seeking to sponsor relatives from outside the EU.
Despite Vote Leave’s insistence that Brexit was mainly about sovereignty and secondarily about concerns over the unfair access to Britain enjoyed by EU migrants, our results suggest otherwise. These are the post-hoc rationalisations of a rider whose anti-immigration elephant is firmly in control.
Question wording:
According to government statistics, about 3 million European Union citizens and 5 million non-EU citizens live in the United Kingdom. Annually, net migration from the EU is 165,000 and net migration from elsewhere (mainly Asia, Africa and the Middle East) is also 165,000. This means that 330,000 more people move to the UK each year than leave.
We would like to know how much net migration you would prefer to have from the EU and from elsewhere. Please indicate your preferences as a number: choosing “0” would mean cutting net migration to zero, while choosing “165,000” means keeping levels as they are currently.
How much net migration should there be from the EU?
How much net migration should there be from outside the EU?


