Which Nations Think over the Long Term?
Razib Khan, Discover, December 16, 2010
One of the major parameters which shape individual success, and macroeconomic growth in the aggregate, is time preference. Time preference basically measures an individual’s future-time orientation. Would you for example take $1,000 in the present, or wait 30 days and accept $1,500 dollars? It doesn’t need to be money, children can exhibit time preference as well. Would you like one candy bar now, or two candy bars in an hour? I also think time preference permeates our lives more concretely. Would you like to eat some greasy food now, or would you forgo epicurean pleasures in the present for a sleeker frame in the future?
Here’s an illustration of the correlates of time preference:
In one of the most amazing developmental studies ever conducted, Walter Michel of Stanford created a simple test of the ability of four year old children to control impulses and delay gratification. Children were taken one at a time into a room with a one-way mirror. They were shown a marshmallow. The experimenter told them he had to leave and that they could have the marshmallow right then, but if they waited for the experimenter to return from an errand, they could have two marshmallows. One marshmallow was left on a table in front of them. Some children grabbed the available marshmallow within seconds of the experimenter leaving. Others waited up to twenty minutes for the experimenter to return. In a follow-up study (Shoda, Mischel, & Peake, 1990), children were tested at 18 years of age and comparisons were made between the third of the children who grabbed the marshmallow (the “impulsive”) and the third who delayed gratification in order to receive the enhanced reward (“impulse controlled”).
The third of the children who were most impulsive at four years of age scored an average of 524 verbal and 528 math. The impulse controlled students who scored 610 verbal and 652 math! This astounding 210 point total score difference on the SAT was predicted on the basis of a single observation at four years of age! The 210 point difference is as large as the average differences between that of economically advantaged versus disadvantaged children and is larger than the difference between children from families with graduate degrees versus children whose parents did not finish high school! At four years of age gobbling a marshmallow now v. waiting for two later is twice as good a predictor of later SAT scores than is IQ.
The issue of causality is probably one which you will immediately bring up. There is a correlation between higher IQ and low time preference (consuming less in the present to have a potential for more consumption in the future), but who knows how the feedback loops here work? For example, unlike many males my age I gave up playing video games around the age of 16. I calculated that I was substituting video games for reading, and that that would have long term consequences which I was not pleased with. {snip}
A new working paper on the SSRN website has some interesting data on time preference cross-culturally. How Time Preferences Differ: Evidence from 45 Countries:
We present results from the first large-scale international survey on time discounting, conducted in 45 countries. Cross-country variation cannot simply be explained by economic variables such as interest or inflation rates. In particular, we find strong evidence for cultural differences, as measured by the Hofstede cultural dimensions. For example, large levels of Uncertainty Avoidance are associated with strong hyperbolic discounting. We also find relations between time preferences and risk preferences, like loss aversion. For instance, subjects with high loss aversion tend to show larger time discounting. Moreover, our analysis shows an impact of time preferences on the capability of technological innovations in a country and on environmental protection.
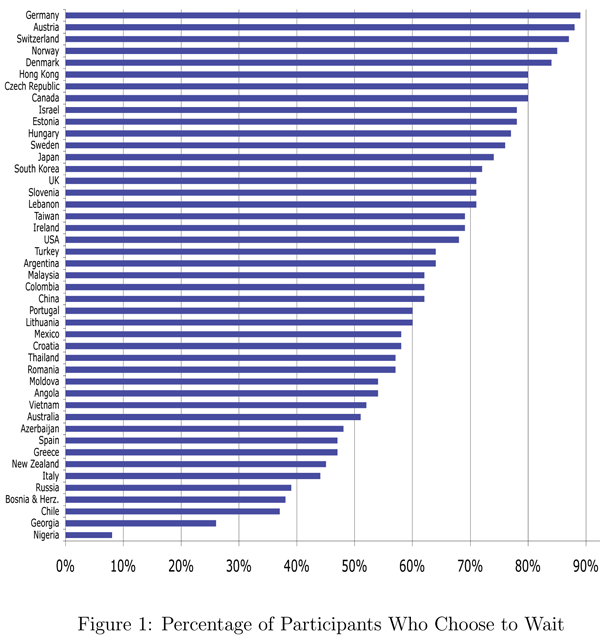
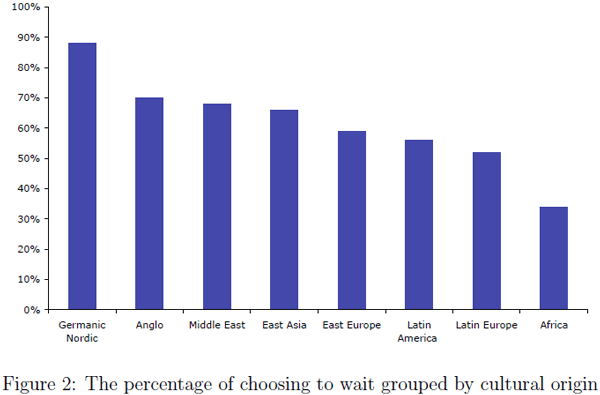
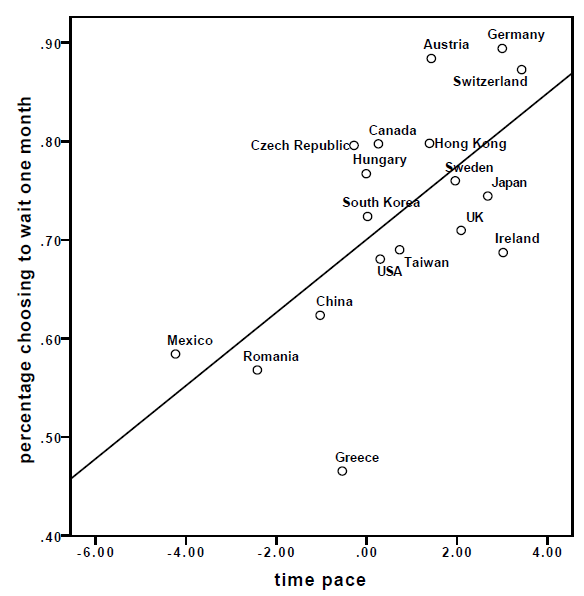
To get published in orthodox economics you need to do a lot of mathematical modeling, but I’m not too interested in that. Rather, let’s look at some of the descriptive results. The first two figures shows the percentage of participants who chose the $3800 option when they were asked to choose between $3400 this month or $3800 next month. The last figure has on the x-axis “time pace.” This is an overall-pace measure is calculated out of three measures: walking speed, postal speed, and clock accuracy.
Some of the text is very illuminating as to cross-cultural differences:
Even for the students from Princeton University, the percentage choosing the patient option is lower than the percentage of German students (80% vs. 89%). Actually some students from our Norway survey even complained that the question was ridiculous because everybody would choose to wait for one month given the high implicit interest rate.
Other results were not surprising:
This result suggests that although the wealth level (and hence a general level of a country’s economy) is crucial to stimulate innovation, the attitude towards future also plays an important role. For example, while 69% of Taiwanese participants prefer to wait in the one-month question, only 44% of our Italian students prefer to wait. The two countries have the same GDP per capita in 2007, but Taiwan scored much higher in the innovation factor than Italy (5.26 vs. 4.19). It is worthwhile to investigate further to what extent and under what mechanism a general attitude towards future is related to the innovation activity.
And yet some were (at least to me):
After controlling the macro-economic variables (GDP per capita, growth rate, inflation rate), participants from countries with higher degree of Individualism and Long Term Orientation are more likely to wait. In contrast, for the present bias and long-term discount factor, the country with higher Uncertainty Avoidance score tend to discount the next year more.
{snip}


