K-12 Spending Has Doubled since 1970, but Student Test Scores Have Remained Flat
Ben Velderman, EAG News, August 8, 2013
{snip}
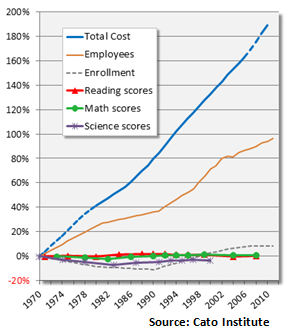
According to a graph produced by Andrew Coulson of the Cato Institute, Americans are spending twice as much on K-12 education as they did in 1970, but students’ math, reading and science scores haven’t increased at all during this 40-year spending binge.
Deroy Murdock of the National Review describes the chart this way:
“The spending curve of government outlays on K-12 education from 1970-2010 is essentially an upward-sloping 45-degree angle. The curves representing reading, math and science test scores are all 0-degree angles. These commonly are called flat lines.
“For all the lavish expenditures that have been lobbed into America’s government schools, U.S. student performance is in its fifth decade of suspended animation.”
The truth hurts sometimes, and Murdock’s words ought to make every teacher union leader and public school apologist wince.
{snip}
How can America solve its K-12 “money for nothing” problem?
Murdock again: “Liquidating the teachers’ unions, enacting voucher and other school-choice options, abandoning the exhausted excuses for poor performance, and–conversely–boosting expectations for all students (regardless of background or circumstances) would help solve this perennial challenge.”
Those are all good suggestions.
But before those ideas can become policies, enough Americans have to be convinced that public education can’t be fixed by throwing more and more money at it. We’ve tried that for 40 years, and it hasn’t worked.
{snip}