Great Moments in Black History: The Black Experience in Chicago, 1790–2013
Paul Kersey, SBPDL, February 14, 2013
… because hiring polices that disproportionately favor blacks were implicit in Washington’s campaign promise, “It’s our turn now, “ Washington’s pledge to make the public work force a mirror reflection of the city’s racial make-up also suggested that merit would not be the leading criterion used in city hiring.
Another plausible interpretation lies in the hypothetical world of what did not happen. Washington did not bring about what whites feared he would: “Papa Doc” policies, a wholesale sacking of whites, and purges that might have changed the complexion of the City Hall labor force overnight.
Yet there is little doubt that Washington dramatically and drastically altered hiring for new jobs in Chicago’s public work force and massively changed hiring priorities. Blacks have benefited the most… and white males and white females have borne the brunt of the loss of job opportunities in this racial and gender shift in hiring. (p. 132) As the 1983 and 1987 election returns showed, about 85 percent of whites voted against Harold Washington and about 98 percent of blacks voted for him.
Add the fact that the overwhelming recipients of administrative preferences, including affirmative action, quote promotions, and contract set-asides, were blacks. This translates into a situation where Washington could reward his friends, and punish his enemies when he followed the body of decrees, court actions, and federal, city, and state guidelines loosely called affirmative action.
Harold Washington, in pursuing and pushing such policies, was behaving like an intelligent Bayesian (after Sir Thomas Bayes, the father of statistics); for he was obtaining what is very often complex information at a very low cost. By merely knowing the race of the voter or seeker of a city job or a contract, Washington could be 98 percent certain that he had rewarded a “friend” and punished an “enemy” by giving preferential consideration to blacks over whites.
As the election returns show, when he awarded a job or a contract to any black registered voter, he was 98 or 99 percent sure of rewarding a friend; conversely, when a qualified white was bypassed in a promotion procedure, or a white contractor or vendor was dropped from city business, the mayor was about 85 percent sure of punishing a political enemy–and abiding by the letter of the law at the same time. That is the political equivalence of alchemy in that it turns base metals into gold, or, at the very least the best thing since sliced bread for the black poltico.
Thus, although the intent of affirmative action and its train of protections, preferences, and racial incentives may be called ‘reform,’ the effect could be very different. It is eminently clear that a mayor who is so inclined could use the system to punish his political enemies and reward his political friends by turning reform into redistributionism. As we have shown in Chapter Six, Washington gave nearly two-thirds of all the newly award top jobs in 1985 (officials and administrators) to blacks and only 24 percent to whites. In city contracts and purchases Mayor Washington set aside 25 percent of all business exclusively for blacks and minorities and 5 percent women; zealous application of such quotas had pushed that figure to nearly 35 percent by December 1986. Affirmative action was thereby turned into a friend of the mayor in power. (p. 157 – 158)
But even at the beginning of the 1980s black integration into the mainstream of the urban political economy remained tediously incomplete. It was slowed by the new conservatism in U.S. politics ushered in by the Reagan administration, and by the precarious position of the vast majority of the black middle class whose income, status, and occupations were overwhelmingly tied to the welfare state and to public employment (i.e., teachers, public administrators, civil servants, government-regulated affirmative action contracts, and employment in social service programs).
As recently as 1985 a survey found that more than 67 percent of black middle-class income earners were dependent on public sector jobs. Moreover, the heavy dependence of poor black families on public assistance had become a cause for national alarm, if not action.
In contrast, a smaller percentage of the white middle-class and poor whites in Chicago were tied to the public sector for employment and/or transfer payments. A higher percentage of whites derived income from the production side of the economy. This accounts for a significant amount of the conservatism on the part of whites who perceive their taxes as supporting black welfare recipients. (p. 38-39)
Missing from this laudatory appraisal was the steep racial inequity experienced by hundreds of thousands of black Chicagoans living on the outskirts and in the shadows of Daley’s “vibrant downtown.” As Time might have noted, endemic black poverty across the city’s vast stretch of conspicuously non-beautified black neighborhoods did not strike the wealthy, the city’s leading corporations, or the mayor as a “big ticket” item requiring concentrated public investment. The $475 million spent on Millennium Park would have been more than welcome in those neighborhoods as an investment in job training, child welfare, after school programs, “green space” expansion , drug treatment… the list of unmet neighborhood needs goes on and on. (p. 48)
Black history and Chicago history intersected from the beginning. The city’s first official settler (Jean Baptiste Pointe- Du Sable) was of African ancestry. The early and arguably “global” Chicago of the pre-Civil War era… was a key stop on the Underground Railroad.
Despite this unusually black-friendly history, however, blacks maintained only a slight presence at the time of the Columbian Exposition [1893]. There were just less than 15,000 African Americans in Chicago in 1890, when Chicago was home to 161,000 German-born immigrants, 70,000 Irish-born immigrants, 43,000 Swedish-born, 38,000 British-born, 25,000 Czechs, 24,000 Poles, and 22,000 Norwegians.
By 1910, the city’s black population had risen to just “40,000 Negroes among the heterogeneous two million inhabitants of Midwest Metropolis.” Blacks composed just 2 percent of the population of the nation’s leading industrial and population growth metropolis, whose spectacular economic and demographic expansion during the late nineteenth and early twentieth centuries was fueled by massive European immigration, primarily Eastern and South-Central European after 1880.
Employed mainly in light and menial work (as porters, butlers, maids, janitors, and the like), few among the city’s small black populace worked in the heavy industries (meatpacking, steel, farm equipment manufacturing, lumber warehousing, electrical wire, etc..) for which Chicago was so famous at the time. (p.76-77)
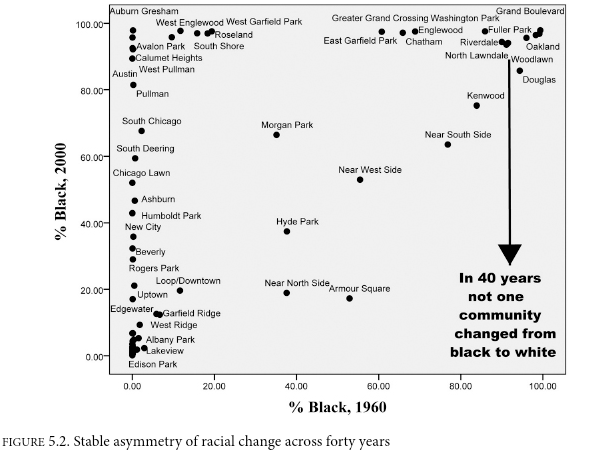
To further elaborate the persistence of racial segregation I examine changes in racial composition across the same four-decade period, plotting the percentage of a neighborhood’s population that was black in 2000 against percent black in 1960, before the major urban transformations [William Julius] Wilson described.
This graph shows that where racial change is abundant it is structured in an asymmetric way, yielding for types of neighborhoods. The first two reflect durable segregation–those that are stably black (upper right) and those that are stably white (lower left). The third type reflects transitional neighborhoods that went either from all white to black (“white flight”) or partially black to segregated black (up the left side and across the top). The fourth type is the small number of integrated communities that have remained so, such as Hyde Park and the Near West Side.
What is startling is the missing type–in the third largest city in America, not one neighborhood transitioned from predominantly black to predominantly white. The lack of observations in the lower right quadrant of the graph indicated that none of the areas that had large percentages of black population in 1960 lost significant shares. In fact, there appears to be a threshold effect of around 50 percent black, above which all neighborhoods either maintained or increased their share of black population.
Figure 5.2 thus tells a story of change within a relatively stable social-ecological structure: there were great shifts in neighborhood racial composition from 1960-2000, but neighborhoods that were initially black stated that way over time, while at the same time many areas of the city remained off limits to blacks. (p. 107-108)