The Twin Crises: Immigration and Crime
Edwin S. Rubenstein, The Social Contract, Summer 2011
Crime rates are at historic lows in the U.S., while the number of legal and illegal immigrants entering the country is at near record highs. Cities experiencing rapid growth in their Hispanic immigrant population often see local crime rates decline. Some see these trends as evidence that immigrants are less likely to commit crimes than natives.
Do immigrants make us safer?
This conclusion appeals to the pro-immigration lobby, but it is intellectually dishonest and does not reflect reality. The (alleged) negative relationship between immigrants and crime is based on data that does not distinguish foreign-born from U.S.-born offenders and ignores the role race, age, and immigration status plays in criminality.
Recent research, including studies by pro-immigrant organizations, indicates that while the national crime rate is falling, crime rates for Hispanics and recent immigrants are rising. The overwhelming evidence — based on national victimization surveys and incarceration statistics — finds that Hispanics are more violence prone than non-Hispanic whites. Equally obvious: non-Hispanic blacks commit crimes at far higher rates than either Hispanics or non-Hispanic whites.
So what is the crime rate for Hispanic immigrants? In its simplest form, it is the number of Hispanic immigrants arrested for crime divided by the total Hispanic immigrant population. Ideally, we would compare this to corresponding rates for native-born whites, blacks, and Hispanics — to determine whether Hispanic immigration increases the overall crime rate.
It sounds simple. But there are big problems.
Most crimes are committed by individuals aged 15 to 44, with the 18 to 29 age range representing a sharp peak in criminal activity. The median age of U.S. Hispanics is around 27, near the peak of the top crime range. But the median for whites is over 40, putting nearly half beyond the range at which crime is likely. Failure to adjust crime rates for age difference can bias the picture
In addition, male inmates outnumber females in U.S. prisons by a ratio of 14 to 1. Since immigrants are (somewhat) more likely to be male, there is a built-in gender bias in immigrant crime statistics.
Ascertaining a convict’s place of birth is fiendishly difficult. Not only are felons reluctant to reveal their country of origin and lack of citizenship, but many localities forbid their police and prison personnel from even asking such questions.
Ideally we would like to compare the crime rates for Hispanics, non-Hispanic blacks, and non-Hispanic whites. Unfortunately the FBI’s Uniform Crime Report database does not separate Hispanics from other racial groups. Hispanic arrestees are reported as “white”, “black”, or even “Asian” — rendering the crime data useless for our purpose.
In fact, most Hispanic perpetrators are lumped in with non-Hispanic whites. This has the effect of narrowing the gap between black and white crime rates (by inflating the white rate) while suppressing information on Hispanic criminality. The inescapable conclusion: many Justice Department bureaucrats are too PC to present the truth on immigrant, primarily Hispanic, criminality.
Luckily, the folks that prepare the incarceration statistics didn’t get the memo. Their data carefully records ethnicity (Hispanic/non-Hispanic) as well as race of the prison population. Accordingly, my go-to source for ethnic crime statistics is the Bureau of Justice Statistics’ (BJS) annual analysis of data provided by federal and state correctional authorities.
The most recent report finds a total of 2,096,300 males were incarcerated in federal and state prisons and local jails at mid-year 2009 — 18 percent more than in 2000. The variation among the races is staggering: the number of white non-Hispanic male inmates rose by 4.5 percent over the 2000 to 2009 period, black-non-Hispanic male inmates were up by 6.2 percent, while the number of Hispanic males in U.S. prisons and jails exploded by 51.9 percent.
More troubling still are the divergent trends of the two most recent years for which we have data. From 2008 to 2009 the number of white male inmates declined by 15,000 (-2.6 percent); black male inmates declined by 5,000 (-0.6 percent); while the count of incarcerated Hispanic males rose by 15,000 (+3.5 percent.)
Of course, a growing Hispanic prison population may simply reflect the equally extraordinary growth in the total Hispanic population. We need incarceration rates to determine that. Fortunately, the Bureau of Justice Statistics calculates these rates — prisoners per 100,000 population — for each race and ethnicity.
As of June 30, 2009 (latest available data) the incarceration rate of black non-Hispanic males — 4,749 inmates per 100,000 U.S. residents — was more than 6 times that of white non-Hispanic males (708 inmates per 100,000 U.S. residents), and 2.6 times higher than Hispanic males (1,822 inmates per 100,000 U.S. residents.)
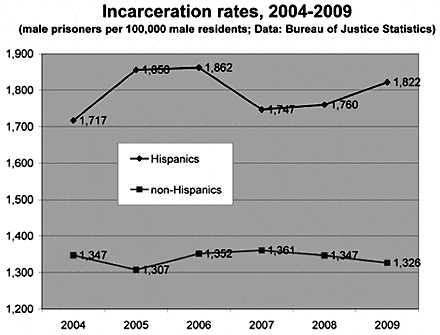
Credit: Edwin Rubenstein / The Social Contract
Notwithstanding high black incarceration rates, non-Hispanics as a whole are significantly less likely than Hispanics to be in jail or prison:
In 2009 there were 1,822 Hispanic males in prison for every 100,000 Hispanic males in the U.S. population, and only 1,326 non-Hispanic males incarcerated for every 100,000 non-Hispanic males. In other words, Hispanic males were 37 percent more likely to be incarcerated than non-Hispanic males.
More importantly, the gap is growing. From 2000 to 2009 non-Hispanic incarceration rates declined while Hispanic incarceration rates rose.
Violent Crimes or Immigration Violations?
In a much-discussed article our old friend Ron Unz presents his own tables, charts, and correlations in an effort to prove Hispanic immigrants are not the crime-crazed group that many Americans suspect they are. [Ron Unz, His-Panic, The American Conservative, March 2010.] Unfortunately, Unz’s analysis of the immigration/crime link suffers from the same ambiguities and inconsistencies as those he (rightly) dismisses.
More unfortunate still: Unz ignores reliable data showing that Hispanics are rapidly catching up to blacks as the most violent demographic in the U.S.
Unz acknowledges that although the Hispanic/non-Hispanic crime rate differential shrinks somewhat in high-crime age brackets, it remains alarmingly high:
“So perhaps those fearful commentators are right and Hispanics commit crimes at roughly two-and-a half times the rate of whites in America.”
But then he demurs, citing extenuating circumstances of age, gender, and lastly, immigration status:
But even these lower figures may still be a bit misleading. As a recent front page New York Times story pointed out, over half of all federal prosecutions these days are for immigration-related offenses, and since a huge fraction of illegal immigrants are from south of the border, the 10 percent or so of U.S. prison inmates who are in federal custody might significantly distort our ethnic imprisonment statistics. Anyway, offenses such as robbery, rape, murder, burglary, assault, and theft are almost always prosecuted in state courts, so it makes sense to separate these street crimes from cases of illegal nannies convicted of illegal nannying.
To which we say: Amen. Our concern with immigrant crime has nothing to do with visa overstayers or even illegal entry per se. We are worried about personal safety.
Surely Unz understands this. Yet he conveniently ignores data that confirm our worst fears regarding Hispanic criminality: From 2000 to 2008 (the latest year of available data) the number of Hispanics serving time for violent crimes increased by 58 percent. Over the same period the number of non-Hispanic blacks jailed for such offenses rose by only 3.0 percent, while the corresponding number of non-Hispanic whites increased nearly 14 percent.
Put differently, the incarceration data indicate that Hispanics account for more than 40 percent of the recent increase in violent crime. That is nearly three times greater than their share of the U.S. population — 16 percent.
NB: Blacks are still far more likely to be incarcerated than Hispanics. There were more than twice as many blacks in prison for violent crimes in 2008 as Hispanics. But Hispanics are obviously narrowing the gap. The marginal perpetrator of violence in the U.S. is far more likely to be Hispanic than black.
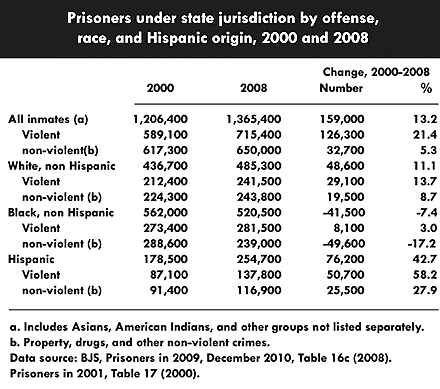
Credit: Edwin Rubenstein / The Social Contract
Unz suggests that murder statistics are the most reliable of all:
A reasonable question arises: are all of these crime rates actual, or might they be statistical artifacts produced by widespread underreporting of crime in heavily Hispanic areas? We cannot absolutely eliminate this possibility, but for homicides the reporting rate is always close to 100 percent, and since for all these cities the homicide and other serious crime rates tend to follow very similar patterns, there is no evidence that any of these racial patterns were warped by substantial underreporting.
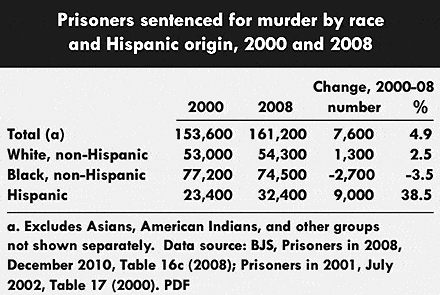
In fact, nowhere is the Hispanicization of violent crime more evident than in homicides:
Overall, the number of prisoners incarcerated for murder rose nearly 5 percent during the 2000 to 2008 period. The number of white non-Hispanics in that group increased by 2.5 percent, while the number of blacks actually fell by 3.5 percent. Hispanics bucked the trend: 9,000 more Hispanics were doing time for murder in 2008 than in 2000 — a whopping 38 percent increase. As far as murder is concerned, the new boys on the cell block are overwhelmingly Hispanic.
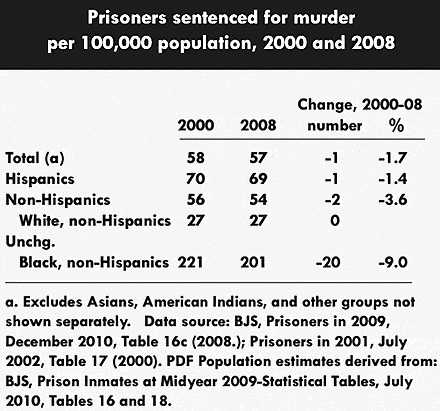
Of course, the Hispanic population is growing faster than that of the other groups. We must therefore adjust for differences in population growth. When we calculate homicide rates — prisoners sentenced for murder as a share of the population of each group — we find that homicide rates for Hispanics exceed those of non-Hispanics, and the gap is growing.
Hispanics were incarcerated for murder at a rate of 69 per 100,000 population in 2008 — or about 29 percent above the comparable rate for non-Hispanics (54 per 100,000.) As noted above, blacks remain the homicide leaders, but their murder rate has declined significantly. While both blacks and Hispanics are far more murder prone than whites, blacks have lowered this gap more than Hispanics.
Why are Hispanic murder rates stubbornly high? At a time when violent crime is declining across the country, it is hard to imagine U.S.-born Hispanics are fueling the upsurge. But Hispanic immigrants, a group disproportionately composed of males in the high-crime age brackets who come from a country where violent crime is on the upsurge, are the likely suspects. As Steve Sailer has pointed out:
Incarceration rates aren’t exactly the same as crime rates. Hispanic immigrants who commit murder area lot likelier to make a run for the border, on the other side of which are waiting friends and relatives, than are American-born homeboys, especially non-Hispanic blacks and whites.
You can see evidence of this at the Los Angeles Police Department’s Most Wanted website. A very large fraction of the LAPD’s Most Wanted have foreign first names, suggesting they were foreign-born.
Credit: Edwin Rubenstein / The Social Contract
A Rising Share: Hispanics and Federal Crime
Even organizations friendly to Hispanic immigrants acknowledge the problem. In 2009 the Pew Hispanic Center published A Rising Share: Hispanics and Federal Crime, an analysis of the race, ethnicity, and citizenship of sentenced federal offenders. The principal finding:
Credit: Edwin Rubenstein / The Social Contract
Sharp growth in illegal immigration and increased enforcement of immigration laws have dramatically altered the ethnic composition of offenders sentenced in federal courts. In 2007, Latinos accounted for 40 percent of all sentenced federal offenders — more than triple their share (13 percent) of the total U.S. adult population. The share of all sentenced offenders who were Latino in 2007 was up from 24 percent in 1991, according to an analysis of data from the United States Sentencing Commission (USSC) by the Pew Hispanic Center, a project of the Pew Research Center.
Federal courts represent a relatively small share of the overall criminal justice system in the U.S. Only 6 percent of all offenders sentenced for a felony are sentenced in a federal court; the remainder are sentenced in state courts, according to the Bureau of Justice Statistics. Because immigration is a federal responsibility, however, all immigration law violations are adjudicated in federal courts. Not surprisingly, the Pew study finds that nearly three-quarters of all Latinos sentenced in federal courts are not citizens, and that these Latinos accounted for 29 percent of all federally sentenced prisoners in 2007 — five times their share of the nation’s adult population (5.1 percent.)
What is surprising is the involvement of non-citizen Hispanics in offenses other than immigration law violations. The Pew report indicates, for example, that non-citizen Hispanics account for 25 percent of those sentenced for drug crimes, 8 percent of white/collar/fraud offenders, and 6 percent of firearms offenders.1
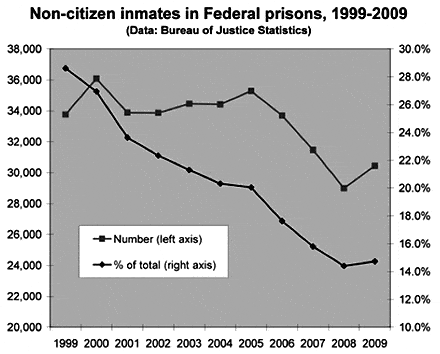
More than 90 percent of the non-citizen inmates in federal prisons are Hispanic. Many are career criminals. Government research finds, for example, that these incarcerated illegal aliens are arrested an average of eight times. Thirty-eight percent had between 2 and 5 arrests, 32 percent had between 6 and 10 arrests, and 26 percent had 11 or more arrests. Almost all of these illegal aliens were arrested for more than one offense. About 12 percent were doing time for violent offenses such as murder, robbery, assault, and sex-related crimes.
Scarier still is the fact that the federal government seems more intent on releasing these folks than holding them: The number of non-citizen criminals has trended downward since 2000, when a record 36,090 criminal aliens were in federal custody. From midyear 2000 to midyear 2009 the numbers fell by nearly 20 percent. Since 1999 the share of federal prisoners who are non-citizens declined by about, from 28.6 percent were non-citizens.
The decade-long decline stands in sharp contrast to the situation in the 1980s and 1990s, when the number of non-citizens serving in federal prison increased by an average of 15 percent per annum.
In part, the recent trend reflects changed federal law enforcement priorities post-9/11, when drug interdiction yielded to anti-terrorism. Yet, as the data clearly show, criminal aliens threaten public safety as much as any terrorist.
Credit Image: Edwin Rubenstein / The Social Contract
Criminal aliens are supposed to be deported when their prison terms are up. Many deportees stay here decades after getting deportation orders because federal, state, and local law enforcement officials are unwilling or unable to expedite their removal. Immigration and Customs Enforcement (ICE) estimated in 2008 that 300,000 to 450,000 criminal aliens who are eligible for removal are detained each year in federal, state, and local correctional facilities.
The Arizona law notwithstanding, deporting even the worst of them is politically difficult. In cities where illegal alien crime is highest, the police cannot use the most obvious tool to apprehend them: their immigration status. These “sanctuary policies” generally prohibit a city’s employees, including the police, from reporting immigration violations to the federal authorities and are a testament to the political power of the pro-immigration lobby.
Avoiding Reality on Immigrant Crime
The Hispanic prisoner boom is a sticky point for immigration enthusiasts. Unz ignores it. A good debater, he diverts attention from inconvenient facts by focusing on other relationships which — at first glance — seem to support his thesis:
Take five minutes to consider the list of America’s urban crime rates provided on Wikipedia, and you will notice an intriguing pattern. Nearly all of the most heavily Latino cities have low or even extremely low crime rates, and virtually none have rates much above the national average. Eighty percent Latino El Paso has the lowest homicide and robbery rates of any major city in the continental United States. This is not what we would expect to find if Hispanics had crime rates far higher than whites. Individual cities may certainly have anomalously low crime rates for a variety of reasons, but the overall trend of crime rates compared to ethnicity seems unmistakable.
Get it? To keep America safe we need to flood our cities with Hispanics.
Reality check: Cities with large Hispanic population shares may indeed have below-average crime rates. But this result obtains not because Hispanics are paragons of virtue — but because they are not blacks. A city’s overall crime rate is a weighted average of rates for its white, black, and Hispanic residents — the weights being population shares of each group. A higher Hispanic population share usually means a lower black population share — and a lower overall crime rate.
Blacks are still the main driver of urban crime rates. The incarceration rate of black non-Hispanic males in peak crime ages 18 to 39, for example, is about 16 times that of their foreign-born Mexican counterparts, and twice that of similar U.S.-born Mexicans. [Ruben G. Rumbaut, et al., “Debunking the Myth of Immigrant Criminality: Imprisonment Among First- and Second-Generation Young Men,” Migration Policy Institute, June 1, 2006. Table 1.]
So as Hispanics displace blacks in America’s largest cities, stable or slightly declining crime rates are not at all surprising. But correlation does not imply causality.
Unz knows this. So do most immigration apologists. Yet they prattle on about the negative correlation between Hispanic population shares and urban crime rates. Ron Unz goes so far as to imply that Hispanics are, statistically speaking, no different than whites:
. . . Taken as a whole, the mass of statistical evidence constitutes strong support for the “null hypothesis,” namely that Hispanics have approximately the same crime rates as whites of the same age.
Yet he hedges his bet:
Admittedly, all of the arguments presented here are somewhat statistical and circumstantial. Correlation does not prove causality, and it might be possible to come up with a complex and detailed set of ad hoc theories and counter-arguments to explain away the vast mass of apparent evidence indicating relatively low Hispanic crime rates. But such an approach places the burden of proof on the wrong side.
In fact, we do not need “complex and detailed” theories to debunk Ron Unz’s benign take on Hispanic criminality. The simple, easy-to-understand prison statistics highlighted above do that. At the end of the day, Unz’s sophisticated analysis merely proves that Hispanics are not blacks.
He has a point. But it is not the point he wanted to make.
Endnotes
1. Center for Immigration Studies, Immigration and Crime: Assessing a Conflicted Issue, November 2009.
2. Department of Homeland Security, Office of Inspector General, Identification of Criminal Aliens in Federal and State Custody Eligible for Removal from the United States, January 2011.


