Excluded Schoolchildren
James Thompson, Unz Review, May 8, 2019
{snip}
From time to time, children have to be excluded from school because their behaviour makes it very difficult to teach other children. {snip}
It is hard to judge exactly how damaging this is to education, but it must be costly, because one disruptive child can damage the educational experience for 30 children. The disruptive child may be offered individual tuition, also costly, but potentially cost-effective if actually effective.
The UK Department of Education has released the 2017 figures for suspensions. The table below is from the downloaded spreadsheet details. I have listed them by the percentage “temporarily suspended” by ethnic group. The full list has groupings which can be extremely heterogenous, such as “Asian” covering both Indians and Pakistanis, so I have omitted those in favour of listing specific groups. I removed one “unknown” category because the ethnic background was unknown.
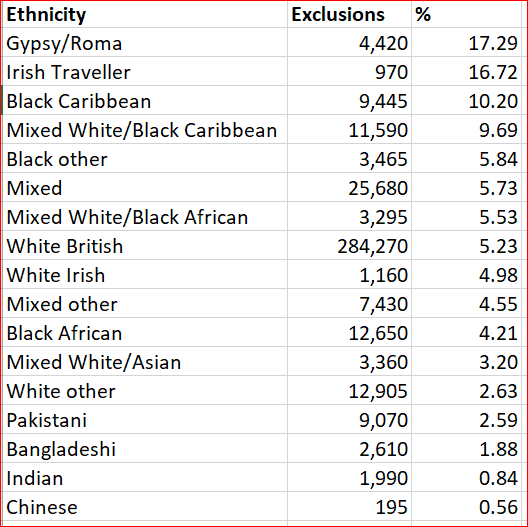
By way of benchmarking, White British children are excluded at the rate of 5.23%. If British teachers were prejudiced against other racial groups, then they would exclude foreign kids at higher rates. Inspection of the rates show this is an unsupported assumption. {snip}
If teacher’s animus is against Black foreigners, then they have got their prejudices the wrong way around. Black Africans are definitely foreign, while Black Caribbeans are British born and have been exposed to as much local culture, cuisine and weather as the White British, yet the Black Africans are excluded at the lower rate of 4.21% and the familiar Black Caribbeans at higher rate of 10.2%.
Of course, every Western nation has its own history as to which immigrants arrived when, and from where. Those who arrive in a particular European majority nation may not be representative of their country of origin: Black Africans appear to be more selected in terms of education, Black Caribbeans less so. Equally, the Indian group is highly selected. {snip}
Overall, the figures are very much like those collected in 2008, which suggests stability of behavioural characteristics over a decade.
{snip}
I interpret these figures as showing that there are enormous behavioural differences between ethnic groups. Gypsies are 31 times more disruptive than Chinese, Black Caribbeans 18 times more so. Overall, I think the genetic hypothesis is the stronger interpretation for the majority of the difference, but a smaller cultural factor can also be argued for.
{snip}
[Editor’s Note: The data from which the author is working come from this study.]


