Toronto Is Segregated by Race and Income. And the Numbers Are Ugly
Sandro Contenta, The Star (Toronto), September 30, 2018
In Toronto, the colour of money is mainly white.
New demographic charts show a strikingly segregated city, with visible minorities concentrated in low-income neighbourhoods and white residents dominating affluent areas in numbers far higher than their share of the population.
The new charts come from University of Toronto Prof. David Hulchanski and his research team, known for using census data to illustrate growing income inequality in the city. Their latest effort flags the role of discrimination in that inequality, with lopsided racial breakdowns that surprised the researchers.
“It’s starker than we would expect,” Hulchanski said in an interview.
Hulchanski revealed the new charts last week in the Netherlands at a conference called “Urban poverty and segregation in a globalized world.”
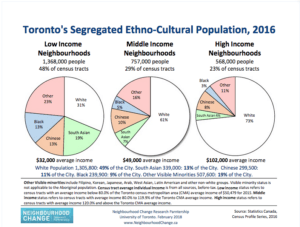
Using the 2016 census, his team calculated that 48 per cent of Toronto’s census tracts are low-income neighbourhoods, where the average individual income is $32,000 before taxes.Fully 68 per cent of residents in these neighbourhoods are visible minorities while 31 per cent are white. (Whites make up 49 per cent of Toronto’s population.)
The main ethno-cultural communities in these low-income neighbourhoods are all overrepresented compared to their share of the city’s population. Black residents, for example, are 9 per cent of the population but make up 13 per cent of residents of low-income neighbourhoods.
High-income neighbourhoods are almost a reverse image. They make up 23 per cent of Toronto’s census tracts, with average individual incomes of $102,000 before tax. Fully 73 per cent of residents in these neighbourhoods are white, far higher than their share of the city’s population. The rest are visible minorities, of whom only 3 per cent are Black.
Whites are also overrepresented in middle-income neighbourhoods, where the average income is $49,000.
“Money buys choice. And people with the most choice are choosing to live in certain areas,” Hulchanski says, explaining the disproportionately high concentration of white residents in high- and middle-income communities.
Choice also partly explains the makeup of low-income neighbourhoods. Some members of ethnic groups prefer to live where their communities are most numerous, giving them easy access to the shops and cultural or religious services that facilitate integration or simply make life more enjoyable.
York University Prof. Carl James, who reviewed Hulchanski’s charts, questions how free the choice actually is for visible minorities.
“We have to think about how the system might have enabled and co-operated in making it possible for some people to access high income neighbourhoods and to stay in those neighbourhoods, or operated to keep others out of those neighbourhoods. It’s not just individual choice. Many other structural things work in relation to choice.”
Studies indicate that discriminatory barriers to good jobs and housing play a determining role.
“Discrimination is not at the same level as in the United States,” Hulchanski says, “but that doesn’t make it any better for those who face that problem here.”
The researchers split the city into high-. and low-income categories by comparing neighbourhoods that were 20 per cent above or below the Toronto Census Metropolitan Area average. Middle-income was within 20 per cent. The team then used census data to see the makeup of those communities.
Evidence of discrimination is reinforced by another chart produced by Hulchanski’s team, showing relatively high levels of education in low-income neighbourhoods. Half of all residents in those areas have a post-secondary degree: 25 per cent from a university and 25 per cent from a community college.
Hulchanski questioned why half the city has average gross incomes of only $32,000 when so many people in those low-income neighbourhoods have relatively high levels of education. “That doesn’t make sense, except for discrimination,” he said.
Another worrying sign for Hulchanski is that 57 per cent of residents in Toronto’s low-income neighbourhoods are immigrants, including established ones who arrived before 2006. Only 31 per cent of residents in high-income areas are immigrants, including 23 per cent who arrived prior to 2006.
The racial segregation of Toronto neighbourhoods is in the context of research, also from Hulchanski’s team, illustrating the growth of low- and high-income neighbourhoods in Toronto, while middle ones steadily disappear.
The polarized income trend dates back to the 1990s, caused by federal and provincial cuts in transfer payments and social assistance, along with tax cuts, rising housing costs and the disappearance of well-paid manufacturing jobs, Hulchanski says.
Government policies caused the income polarization, and only government policies can reverse it, he argues. Hulchanski warns that in Europe, where the trend is less severe, income polarization and ethnic segregation has contributed to the rise of far-right populist movements and outbreaks of violence.
“How long can this continue?” Hulchanski asks. “There is no sign of the trend reversing yet.
“Will there be riots in Toronto? Who knows?”
[Editor’s Note: The original story contains additional charts.]


