What’s Behind the Rise of Interracial Marriage in the US?
Mona Chalabi, The Guardian, February 21, 2018
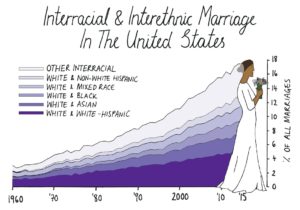
It’s been half a century since the US supreme court decriminalized interracial marriage. Since then, the share of interracial and interethnic marriages in America has increased fivefold, from 3% of all weddings in 1967 to 17% in 2015.
The Loving v Virginia ruling was a clear civil rights victory, but as Anna Holmes reflects in a recent article for the New York Times, understanding who benefits from that win and how is a much more complicated story.
For a start, there’s huge geographic variation in where intermarriage happens; it’s more common in metropolitan areas than rural places (18% compared to 11%) according to a Pew analysis of the Census Bureau’s figures. But those are just averages — US metropolitan areas vary significantly from Honolulu, Hawaii, where 42% of weddings are interracial to Jackson, Mississippi where the figure is just 3%.
Overall, the most common type of intermarriage is between a partner who is white and one who is Hispanic of any race — those relationships accounted for 38% of all intermarriages in 2010. White-Asian couples accounted for another 14% of intermarriages, and white-black couples made up 8%. You can find detailed maps of intermarriage patterns at a county level in this Census Bureau poster.
There are gender patterns in this data too. In 2008, 22% of black male newlyweds chose partners of another race, compared to just 9% of black female newlyweds. The gender pattern is the opposite among Asians. While 40% of Asian females married outside their race in 2008, just 20% of Asian male newlyweds did the same. For whites and Hispanics though, Pew found no gender differences.
These numbers aren’t simply a matter of love. They’re the consequence of economic, political and cultural factors. To list just a few:
- Attitudes (plain racism): While 72% of black respondents said it would be fine with them if a family member chose to marry someone of another racial or ethnic group, 61% of whites and 63% of Hispanics said the same. More specifically though, Americans aren’t comfortable with specific kinds of intermarriage. A Pew survey found that acceptance of out-marriage to whites (81%) was higher than is acceptance of out-marriage to Asians (75%), Hispanics (73%) or blacks (66%).
- Migration patterns: The Census Bureau provided the following examples: “the removal of many American Indian tribes from their original lands to reservation lands; historically higher proportions of Hispanics living in the Southwest; historically higher proportions of Asians living in the West” all of which shape where intermarriages happen and between whom.
- Availability of partners: Systematic incarceration of young black men, together with higher death rates contribute to the fact that black women are much less likely to get married than women of any other race or ethnicity in the US. This, together with higher black unemployment rates mean that black individuals make up a relatively small share of all marriages, including intermarriages.
- Education: People with a higher educational attainment are more likely to intermarry. This affects geographic patterns too – areas with higher educational attainment are more likely to have more interracial couples living there.