Race and Crime: Who Attacks Whom?
Jared Taylor, American Renaissance, December 2, 2020

The United States keeps better statistics on race and crime than any other country in the world. However, the US Bureau of Justice Statistics has only recently begun to treat Asians as a separate category and to distinguish Hispanics from whites.
The single best source for interracial crime data is the National Crime Victimization Survey (NCVS). It is an annual survey of more than 200,000 Americans, carefully chosen to represent the whole country. Each person lists the violent crimes of which he was a victim during the previous six months, including the race, sex, and approximate age of the attacker. The crimes are rape or sexual assault, robbery, aggravated assault, and simple assault. The findings are then converted into annual figures, most of which are for single-offender/single-victim crimes only. The NCVS does not ask about murder because the victims are dead. However, the number of murders is relatively small: 16,214 in 2018, or not even 0.3 percent of the 6,386,000 people calculated by the 2018 NCVS to have been victims of violent crime.
NCVS findings are not biased by police or justice system “racism,” because they are a direct survey of crime victims. Many people think statistics on arrests, convictions, and imprisonment reflect “systemic bias” and therefore cannot be trusted, but these survey data reflect the actual experiences of crime victims, unfiltered by any contact with police or the courts. The NCVS is also the only national source for crimes that are not reported to the police. Victims tell the NCVS about all crimes, and the survey finds that Americans file reports on only about half of all violent crimes.
It is possible that victims could have faulty memories, or lie. They could invent crimes, ignore actual crimes, or lie about the race or sex of the attacker. However, there is no obvious reason to lie, and year to year, the results are generally consistent, even though the survey sample changes. NCVS information is the the best we have.
The NCVS for 2018 was the first to treat Asians as a separate category, and for that reason has special value. It reports races of perpetrators and victims in Table 14, reproduced here.
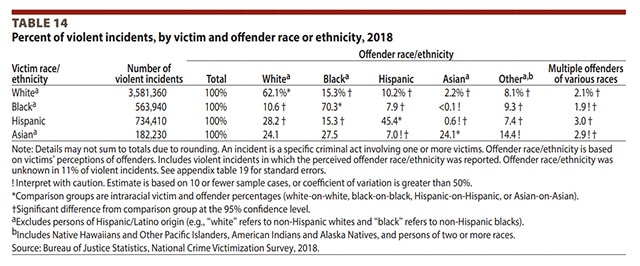
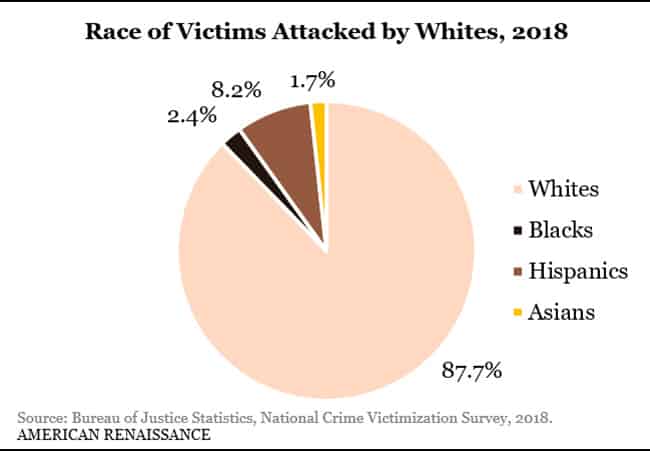
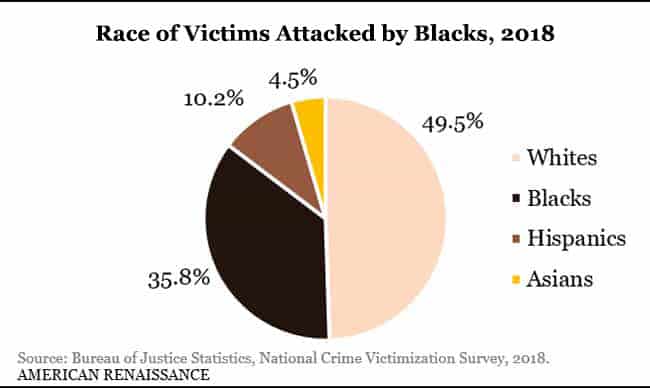
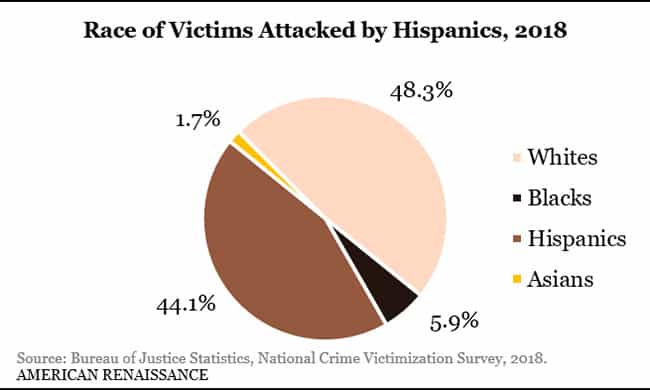
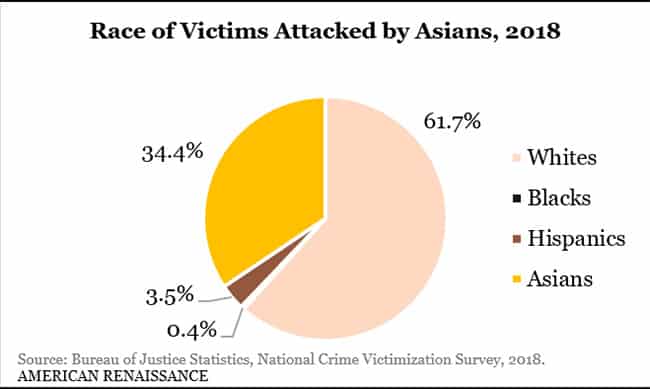
It is easy to calculate how often criminals of each race attack each other, and this information is included in the pie charts below. (Cases in which the race of the attacker was “other,” and those with attackers of various races are not included.) When whites committed violent crimes, they chose white victims nearly 90 percent of the time, and blacks only 2.36 percent of the time. However, violent criminals of every other race chose whites as victims more often than people of any other race, including their own. Violent black and Hispanic criminals choose whites almost half the time, and Asians choose white victims 62 percent of the time.
How likely is a person of a given race to attack someone of a different race? The 2018 NCVS found approximately 608,000 crimes of interracial violence involving blacks and whites. Of this number, blacks were the aggressor in 90 percent of cases, and whites in just 10 percent. The NCVS gives the percentages of the US population of each race (white: 62.3, black: 12, Hispanic: 17, Asian: 6.3, other: 2.4), so we can calculate the odds of any given black person attacking a white or vice versa: The odds of a black person attacking a white were 48 times greater than the odds of a white attacking a black. Blacks were more likely to attack people of every other race more often than they were attacked by them: 47 times more likely to attack an Asian than vice versa, and 3.6 times more likely to attack a Hispanic.
The odds of a Hispanic attacking a white were 6.5 times greater than the reverse. Asians commit crime at lower rates than other racial groups (gambling offenses are the only exception). However, when they do commit interracial violence, they are 18 times more likely to attack a white than vice versa. The NCVS figures for Asians do not include Pacific Islanders, who have higher violent crime rates than East Asians. When all non-whites are taken together, the odds of a non-white attacking a white person were 6.8 times greater than those for a white person attacking a non-white.
The rates of white victimization by people of other races are dramatic, but they should not be misinterpreted. They are high because whites rarely attack non-whites. If, for example, whites attacked only one Asian but Asians attacked 10 whites, there would be only 11 Asian/white crimes, but there would still be 10 times as much Asian-on-white as white-on-Asian violence. The following pie charts put this in perspective.
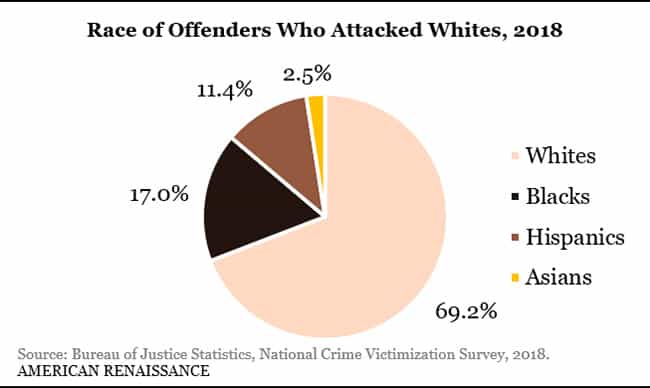
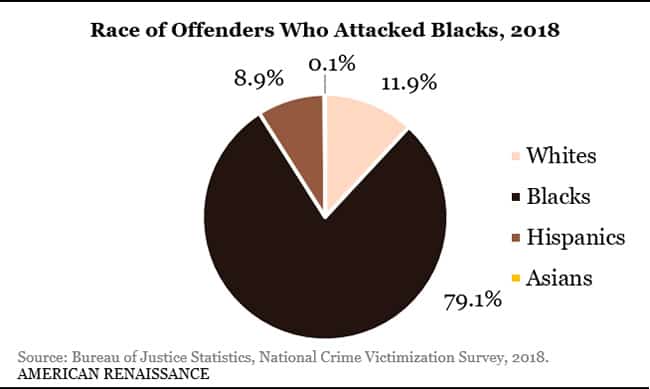
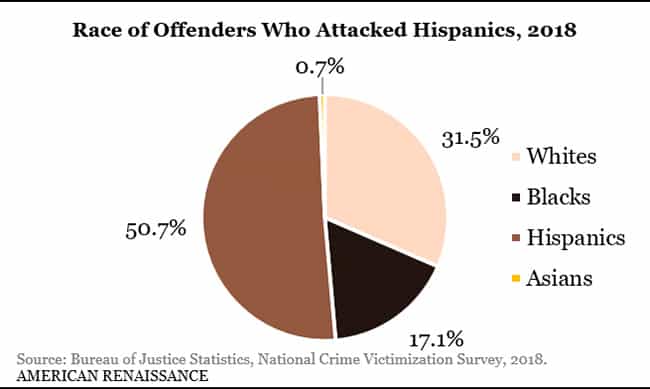
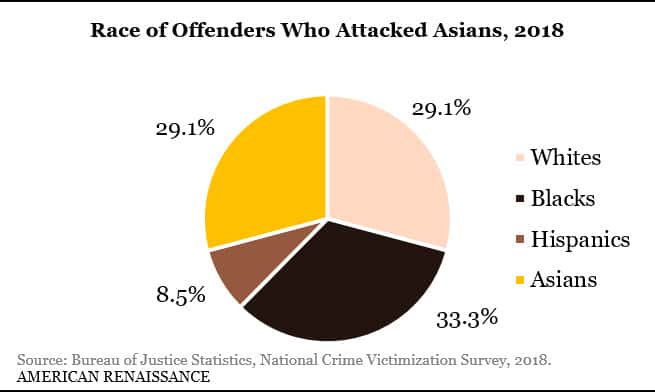
Nearly 70 percent of the people who rape, rob, and assault whites are white, and only 17 percent are black. Statistically, whites have more to fear from people of their own race than from non-whites. This is even more the case for blacks; nearly 80 percent of their attackers are fellow blacks. Hispanics, likewise, have more to fear from Hispanics than from anyone else, but nearly half of their attackers were people of some other race. Asians were the only group more likely to be attacked by someone of a different race; about 70 percent of their attackers were not Asian, with blacks the most frequent aggressors.
Tables 12 and 13 of the 2018 NCVS report sex differences in violent crime. As expected, men were more violent than women, at a ratio of 4.5 to one. Women were reported as the attackers in just over 1 million incidents of criminal violence, while the figure for men was 4.2 million (The odds rise to 4.5 because the US population is not evenly split between men and women; men are only 48.6 percent of the population. There were 258,000 cases in which both men and women were attackers.) Both sexes attacked women more often than men. Women chose women as victims 61 percent of the time; men did so 51 percent of the time. A man was 5.8 times more likely to attack a woman than was a woman to attack a man. As noted above, any given non-white was 6.8 times more likely to attack a white. Therefore, the odds of a non-white attacking a white are greater than the odds of a man attacking a woman. In terms of odds ratios, non-whites were more dangerous to whites than men were to women. The NCVS does not report victimization by both race and sex, so we don’t know, for example, how many Hispanic women attacked Asian men.
The idea that whites are committing horrific violence against non-whites — especially blacks — is widespread. As newscaster Megyn Kelly recently reported, Collegiate School in New York City, to which she was sending two sons for $56,000 per year each, circulated a letter to staff and parents claiming that “white kids are being indoctrinated in black death” and that “black bodies drop like flies around us by violence at white hands.” Many whites even repeat the slogan, “White silence is violence.” As the NCVS makes clear, actual violence runs very much in the other direction.


