What Miscegenation Means for America
Edward Dutton, American Renaissance, December 13, 2020
This essay is adapted from the new book Making Sense of Race, which can be purchased here.
When we hear the word “ethnicity,” we tend to think of peoples, such as the Irish or Han Chinese, that trace their ancestry and history back millennia. But, of course, race and ethnicity are dynamic and evolving. Ethnic groups that have a “timeless” conception of themselves have, in fact, experienced more genetic change and engaged in more interbreeding than they might want to admit. Furthermore, there is no reason why we wouldn’t expect new and different ethnicities to emerge in the future.
Race is best understood as a subspecies of mankind; and ethnicity, a kind of “sub-sub-species” or hybrid cline. In other words, sometimes an ethnicity is a subgroup of a race, which has been relatively isolated for some reason or another; other times, ethnicities emerge through the combination of two or more races. Over the past 50 years, the world, and particularly the Western world, has become increasingly multicultural and multiracial, due to immigration and the tremendous advancements in transportation and communication. This has led, unsurprisingly, to increased interbreeding between races and ethnicities — and interbreeding between groups that, before the age of globalization, would have scarce contact with one another. There comes a point at which a hybrid between two groups merits being understood as an ethnicity all of its own. This process of ethnogenesis — literally, the generation of a new ethnicity — takes centuries, but we can look at current trends in marriage and dating and at least speculate about the ethnicities of the future.
The United States has emerged as a kind of laboratory in this regard. Non-Hispanic whites are roughly 60 percent of a population of 330 million; African-Americans, 13 percent; Hispanics, 20; Asians 6; and American Indians, just over 1. According to current projections, America will become a “majority-minority” nation in the next 25 years; that is, no one race will hold sway demographically. Even in such an environment, marriages are still overwhelmingly intra-racial.1 If love were truly blind, that would not be the case. At the turn of the century, Americans were 75 percent less likely to know a person of another race “with whom they discuss important matters” than would happen by chance.2
It is important to point out, however, that the number of mixed- marriages has more than tripled since the overturning of anti-miscegenation laws in 1967. The Pew Research Center reports that, as of 2015, “intermarriage” occurred among around 17 percent of newlyweds (people married in the past year). The intermarriage rate is slightly higher in metropolitan areas, where Americans are more likely to encounter people of other races.3
Among 2015 newlyweds, white people chose a spouse of another race just over 10 percent of the time. Rates of intermarriage are significantly higher among other races: African-Americans, 18 percent; Hispanics, 27 percent; and Asians, 29 percent.4 While Asians are intermarrying slightly less often than 40 years ago (from 33 to 29 percent), the rate at which blacks intermarry has tripled in the same period of time (from 5 to 18 percent).
Percentage of U.S. Newlyweds Who Are Intermarried
| Race | 1980 | 2015 |
| Asian |
33 |
29 |
| Black |
5 |
18 |
|
Hispanic |
26 |
27 |
| White |
4 |
17 |
| Total |
7 |
17 |
There are significant racial and sexual differences in intermarriage. While white and Hispanic men and women intermarry at largely the same rate, blacks and Asians do not. Twice as many black men (24 percent) intermarry as black women (12 percent). With Asians, something like the reverse is true: more than a third of Asian women intermarry, while 21 percent of Asian men do.
Percentage of 2014-15 U.S. Newlyweds Who Are Intermarried, By Sex
| Race | Men | Women |
| White |
12 |
10 |
| Hispanic |
26 |
28 |
|
Black |
24 |
12 |
| Asian |
21 |
36 |
The most common form of intermarriage by far is between whites and Hispanics, which makes up 42 percent of the total, followed by white and Asian partnering (15 percent) and white and black marriages (11 percent).
Percentage of 2014-15 Opposite-Sex Newlywed Couples
| Coupling | Percent of All Intermarried Couples |
| White/Hispanic |
42 |
| White/Asian |
15 |
|
White/Multiracial |
12 |
| White/Black |
11 |
| Hispanic/Black |
5 |
| White/American Indian |
3 |
| Hispanic/Asian |
3 |
| Hispanic/Multiracial |
3 |
Male and female whites and Hispanics marry each other, more or less, at the same frequency. But from there, significant disparities emerge. As mentioned, Asians are the most likely race to “marry out,” and when they do, 75 percent of them marry whites. The number of couples with a white husband and Asian wife is almost three times the size of a pairing of an Asian husband and white wife. Similarly, couples with a black husband and white wife are more than twice as common as ones with a white husband and black wife.
Percentage of Opposite-Sex Newlywed Couples, Broken Down By Husband and Wife Pairing
| Coupling | Share of Intermarried |
| White Husband/Hispanic Wife |
22% |
| Hispanic Husband/White Wife |
20% |
|
White Husband/Asian Wife |
11% |
| Asian Husband/White Wife |
4% |
| White Husband/Black Wife |
3% |
| Black Husband/White Wife |
7% |
| Hispanic Husband/Black Wife |
1% |
| Black Husband/Hispanic Wife |
4% |
In many ways, the Pew Research Center’s Report from a half- decade earlier provides more detail than the one which employs data from 2015.5 According to this data, in 2008, when whites males who had married someone of a different ethnicity in the last 12 months were asked what ethnicity it was, 46.1 percent said “Hispanic” and 26.9 percent said “Asian,” the second highest category. Only 6.9 percent said “black.” For white women, only 9.4 percent said “Asian,” whereas 51.4 percent said “Hispanic” and 20.1 percent said “black.”
A white-Hispanic partnering, the most common intermarriage in America, does not foretell ethnogenesis. The term “Hispanic” has always been ambiguous, because it is a linguistic, not an ethnic, category. Genetically speaking, “Hispanic” connotes people of mixed European and Amerindian backgrounds — which is not being fundamentally affected through these intermarriages. Their offspring will simply be regarded as Hispanic or white, depending on the case. It’s worth pointing out, however, that this identity choice will have a small, though significant, effect on overall demographics as it is calculated by the U.S. Census.
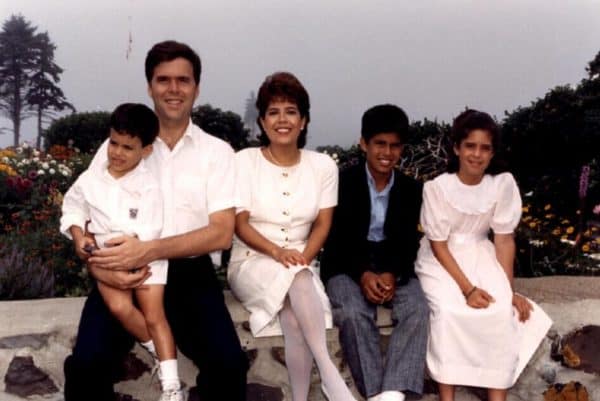
Jeb and Columba Bush with their children, Jebby, George P., and Noelle. (Credit Image: George Bush Presidential Library)
More noteworthy is the next most common interracial pairing: whites and Asians (again, usually East Asians), which accounts for 15 percent of the total. This is a new cline. Just as breeding between white males and Amerindian females produced Hispanics — who then went on to intermarry — there is an on-going process whereby white American males forming unions with East Asian American females might become an example of ethnogenesis.
This high rate of out-marriage among Asians likely reflects the relatively low number of Asians in the U.S.; indeed, as their population has grown, Asian “marrying out” has become slightly less common, falling by some 12 percent between 1980 and 2015. It may also reflect the way that females in particular wish to marry hypergamously and thus, potentially, to someone of another race, and especially to a white man, if being white is associated with status.
Consistent with this, according to 2008 data, 39.5 percent of Asian American women marry people of a different race — 76 percent of these to whites — compared to 19.5 percent of Asian American males who do so. Among African-Americans, this relationship is reversed: 22 percent of black males marry someone of a different race (in 57 percent of cases to white women), compared to 8.9 percent of African-American women (58 percent of these cases to white men).
We see this “inequality of attraction” in dating as well. In 2009 and 2014, the popular dating site OkCupid released meta-data on race and gender generated by its tens of millions of users. It was analyzed by the site’s co-founder, Christian Rudder — who subsequently deleted his post. As New York magazine lamented, “the results did not quite suggest a colorblind utopia of post-racial love. Most races preferred to date within their own race. Asian men and black men received fewer messages than white men, while black women received the fewest messages of all users.”6
One of the most salient analyses was based on “QuickMatch” scores, in which the user is asked to rate a photo of a potential date between 1 and 5. The scores below are separated out by race and sex and show the percentage compared to the average; for example, Asian men rate Asian women 15 percent above the average woman, but rate black women 20 percent below the average. We find that women strongly prefer men of the same race, somewhere between 18 to 24 percent above the average. The same, however, is not true for men. Both black and white men seem to prefer Asian women slightly more than women of their own races. Black men are the least picky in terms of the race of the women they seek to date, as revealed by the small range of their responses. And overall, black women and Asian men receive the lowest scores from other races.
| Asian Women | Black Women | Latina Women | White Women | |
| Asian men rating . . . |
15% |
-20% |
2% |
3% |
| Black men rating . . . |
2% |
1% |
2% |
-6% |
|
Latino men rating . . . |
4% |
-18% |
10% |
4% |
| White men rating . . . |
9% |
-17% |
3% |
6% |
| Asian Men | Black Men | Latino Men | White Men | |
| Asian women rating . . . |
24% |
-27% |
-15% |
18% |
| Black women rating . . . |
-13% |
23% |
-3% |
-6% |
| Latina women rating . . . |
-14% |
-16% |
18% |
12% |
| White women rating . . . |
-12% |
-8% |
1% |
19% |
With regard to the racial marriage patterns noted, Genetic Similarity Theory would predict that whites and Hispanics would be attracted to each other, due to their relative genetic similarity. Also, there is some evidence that U.S. inter-racial marriages involve a trade-off of desirable traits, especially in black male/white female unions. In these unions, the black male tends to be of relatively high educational status compared to the woman, meaning that the female marries hypergamously in terms of education. It is proposed that this compensates for the fact that the female is marrying hypogamously (that is, socially downwards) in terms of racial status. In other words, she has engaged in status exchange.7
Regardless, we can see that a process of ethnogenesis is occurring in the U.S., primarily based around unions between white males and East Asian females. This has long been occurring in Hawaii, due to the established Japanese minority there, and the products of these unions are known by the Hawaiian word “Hapa,” which refers to a person of mixed ethnicity. Young people throughout the U.S. who are part white and part East Asian have increasingly embraced Hapa as a marker of their identity, though some Hawaiian activists have criticized this as an example of “cultural appropriation.”8 It is worth noting that black-white biracials in the U.S. likely have a white mother, whereas Asian-white biracials are likely to have a white father. It is possible that this may lead to some effects in terms of which traits are inherited, but with the current state of research, this can only be speculated upon. According to Pew’s research, contracting a mixed-race marriage is positively correlated with education level. This may be due to the relationship between educational attainment and intelligence, something which is in turn associated with Openness. It may also be because of “exposure”: as blacks, in particular, become more educated, they are more likely to live in areas where there are many whites.9 However, there remains only a very weak relationship with education level.

Founder and CEO of Facebook Mark Zuckerberg and his wife Priscilla Chan attend the awarding ceremony of the 2019 Breakthrough Prize in San Francisco on Nov. 4, 2018. (Credit Image: © Wu Xiaoling/Xinhua via ZUMA Wire)
What is clear is that the American nation is changing dramatically. To understand this, one can look to Silicon Valley, California — America’s avant-garde region in terms of technology, culture, finance, and, increasingly, demographics. As of 2017, “Asians” — mostly from China and India — made up the largest majority (34 percent) in Silicon Valley, a collection of counties of 3.1 million. Among the share of highly skilled and educated workers, some 14 percent alone were from China, which rivaled the numbers from the state of California (17 percent) and the U.S. at large (16 percent). India outnumbered them all, making up 26 percent of high-skilled tech workers.10
A situation like this will not render race “irrelevant” so much as it will generate a new people — or, more likely, peoples. We shouldn’t expect Peoria, Illinois, to resemble Silicon Valley anytime soon; however, the dramatic transformation that America is currently undergoing will unquestionably transform its collective feeling of nationalism — and xenophobia — in the not-too-distant future.
- Del Thiessen and Barbara Bregg, “Human Assortative Mating and Genetic Equilibrium: An Evolutionary Perspective,” Ethology and Sociobiology, 1 (1980): 111-140.
- Miller McPherson, Lynn Smith-Lovin, and James M Cook, “Birds of a Feather: Homophily in Social Networks,” Annual Review of Sociology, 27 (2001): 415-444.
- Gretchen Livingston and Anna Brown, “Intermarriage in the U.S. 50 Years After Loving v. Virginia,” Pew Research, May 18, 2017, https://www.pewsocialtrends.org/2017/05/18/intermarriage-in-the-u-s-50-years-after-loving-v- virginia/ (accessed May 15, 2020).
- “Asian” in a U.S. context appears to refer mainly to East Asians, while in Britain it refers to South Asians. In the following discussion, I use “Asian” in the American sense.
- Paul Taylor, Jeffrey Passell, Wendy Wang, et al., “Marrying Out: One-in- Seven New U.S. Marriages in Interracial or Interethnic,” Pew Research, June 4, 2010, https://www.pewtrusts.org/en/research-and-analysis/reports/2010/06/04/ marrying-out-oneinseven-new-us-marriages-is-interracial-or-interethnic (accessed May 15, 2020).
- Allison P. Davis, “New OkCupid Data on Race Is Pretty Depressing,” New York, September 11, 2014, https://www.thecut.com/2014/09/new-okcupid-data-on-race-is-pretty-depressing.html.
- Aaron Gullickson, “Education and Black/White Interracial Marriage,” Demography, 43 (2006): 673-689.
- Ameki Johnson, “Who Gets to be ‘Hapa?’” National Public Radio, August 8, 2016, https://www.npr.org/sections/codeswitch/2016/08/08/487821049/who-gets-to-be-hapa?t=1596013424206 (accessed May 15, 2020).
- Gullickson, “Education and Black/White Interracial Marriage,” op cit..
- Joint Venture Silicon Valley, “2019 Silicon Valley Index,” Institute for Regional Studies, https://jointventure.org/images/stories/pdf/index2019.pdf (accessed May 15, 2020).


