Latest ACT Test Results
Henry Wolff, American Renaissance, October 2011
ACT (known until 1996 as American College Testing) publishes a national college admission and placement examination that has been in use since 1959. Its popularity is increasing. Forty-nine percent — about 1.62 million — of 2011 high school graduates took the exam at least once, slightly more than took its competitor, the SAT. Composite ACT scores range from 1 to 36 in a bell-curve distribution. The test is accepted at all US colleges and universities, though not all require it. Most students take the ACT test in their junior or senior year, and a student may take it as many as 12 times.
Since 2006, the ACT organization has released data on the percentage of students who met its College Readiness Benchmarks, which it defines as “minimum scores needed on the ACT subject area tests to indicate a 50% chance of obtaining a B or higher or about a 75% chance of obtaining a C or higher in corresponding first-year credit-bearing college courses.” The four ACT subject-area tests are English, math, science, and reading, which correspond to freshman courses in English Composition, Algebra, Biology, and introductory social sciences.
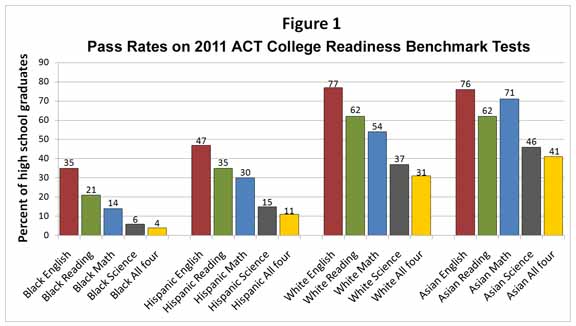
There are considerable racial differences in scores (see Figure 1). In 2011, only 4 percent of blacks and 11 percent of Hispanics met all four College Readiness Benchmarks, compared to 31 percent of whites and 41 percent of Asians. This means that Asian graduates who took the ACT are 10 times more likely than black graduates to be prepared for all four college courses. Scores for American Indians track those for Hispanics almost perfectly.
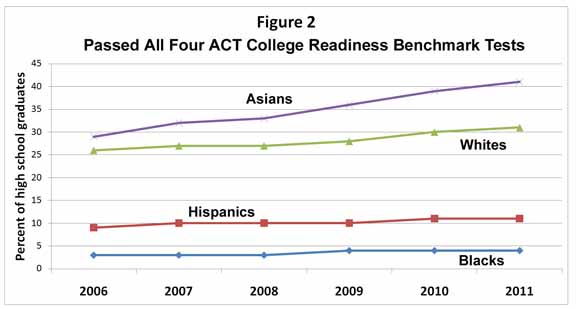
Since 2006, there has been only slight improvement in black and Hispanic scores, whereas whites and especially Asians have made considerable gains (see Figure 2). All four racial groups improved in math and science, but in English and reading, Hispanics did not show much improvement, and black scores declined.
These four groups accounted for 90 percent of the one quarter of high school graduates who met all four College Readiness Benchmarks (the other 10 percent were American Indian, mixed race, or undeclared). Of that 90 percent — 362,920 students in all — 83.9 percent were white, 7.6 percent were Asian, 6.1 percent were Hispanic, and 2.5 percent were black. If college admissions were limited to these students, campuses would be overwhelmingly white.
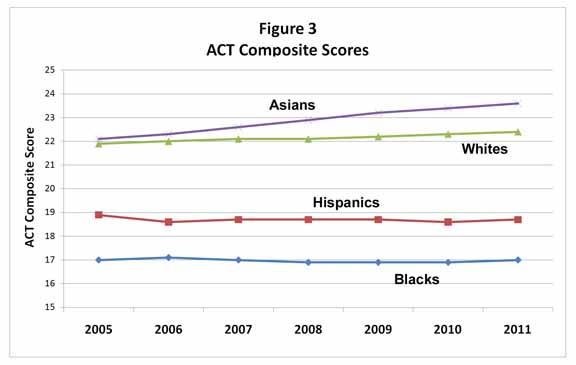
The ACT achievement gap seems to be increasing (see Figure 3). Average composite scores for blacks have not improved since 2005, and those for Hispanics dropped by 0.2. Whites have improved by 0.5 and Asians by 1.5.
In 2010, the ACT published a report called “Mind the Gaps: How College Readiness Narrows Achievement Gaps in College Success.” It noted that “racial/ethnic and family income gaps may seem large and persistent” but assured readers that a “straightforward remedy” would be to provide underachievers with a “rigorous core curriculum that is clearly focused on the essential knowledge and skills for college and career readiness.”
Affirmative action ensures racial diversity in the freshman class, but not as much in the graduating class. Six years after enrolling in four-year colleges, the following percentages of the different groups have graduated: Asians – 71 percent, whites – 68 percent, American Indians – 55 percent, Hispanics – 54 percent, blacks – 51 percent. Furthermore, according to the report, Indians, Hispanics, and blacks are “almost twice as likely to take one or more remedial courses in college as are Asian American and white students.”
The report notes that minorities are projected to become the majority by 2050, and adds somberly that “persistent gaps in college success among racial/ethnic and family income groups [will] become untenable.”
[Editor’s Note: This article first appeared in the October 2011 issue of American Renaissance.]


