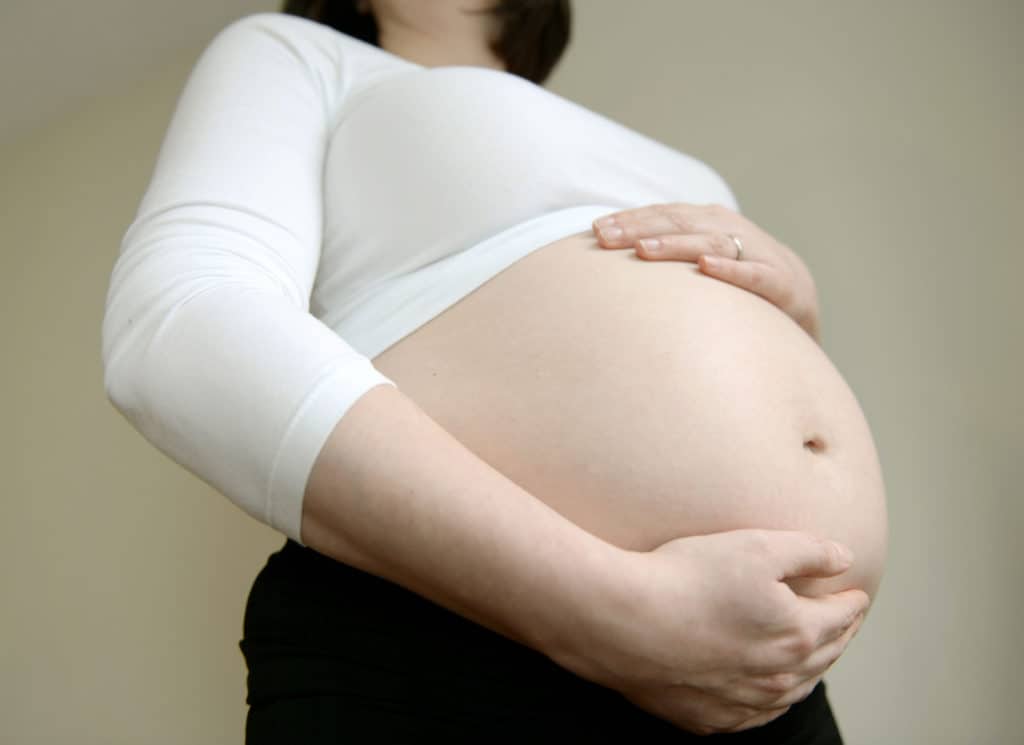
A Timeline of America’s Fertility Rate
Chris Roberts, American Renaissance, December 16, 2019

Credit Image: © Andrew Matthews / PA Wire via ZUMA Press
Benjamin Elisha Sawe recently published a remarkable essay on the World Atlas website, “Plummeting Fertility Rates In The United States: 1800 To 2020.” Here’s a summarized timeline of the 220-year history.
- 1800: Average woman has seven or eight children over the course of her life.
- 1850: Average woman has five live births over the course of her life.
- 1875: Average woman has 3.3 live births over the course of her life.
- 1930: Average woman has two or three children over the course of her life.
- 1940-1960: National fertility rates go up by around 60 percent during the famous “baby boom.”
- 1960-1980: National fertility rates go down again and stabilize around replacement level (2.1 births per woman).
- 1980-present: Fertility rates for women aged 30 or more begin to steadily increase. The author observes, “The trend has been aided by the delayed age of first marriage, first birth, and infertility treatment, which has enabled birth at a later age.”
- 1991-2017: One of the sharpest declines in fertility is among teens. In ’91, for every 1,000 girls between the age of 15 and 19, 62 gave birth. By ’17, the fertility rate for that age group has plummeted by 69 percent, to about 19 births for every 1,000 girls.
- 2007-present: This period is the least fertile in American history, a trend often attributed to the 2007/2008 economic crash.
- 2016: First time in American history that women aged 30 to 34 are the most fertile age group.
- 2016-present: Fertility rates remain below replacement level. Unfortunately: “Experts believe that the probability of a massive rebound in the fertility rate in 2020 and the foreseeable future is low.”
However, the author has some hope.
. . . policies that allow women to combine work and parenthood are likely to increase birth rates significantly. Systems that enable women to work and have children at the same time with ease will not only encourage more female participation in the labor force but also encourage them to have more children.
Well, let’s hear it for working remotely!
As one American Renaissance contributor put it, “Nations are made in the maternity ward.” Nations with serious leaders, like Poland and Hungary, have already implemented policies to increase their native birth rates. For now, Americans must look on in envy.
Americans also have another problem. Hungary and Poland are relatively homogeneous. Pro-natalist policies are pro-white in those countries. America is, unfortunately, no longer an overwhelmingly white country. Fertility rates differ among America’s ethnic groups.
- Asians had the lowest rate, at 1.53
- Whites were at 1.64
- American Indians or Alaskan Natives were at 1.65
- Blacks were at 1.79
- Hispanics were at 1.96
- Native Hawaiian or other Pacific Islanders had the highest rate at 2.11, continuing a massive demographic turnaround
If America started providing more benefits for large families, white taxpayers could end up subsidizing the growth of the non-white population.
However, it’s also possible Asians and whites consider financial matters more carefully than other populations when they decide whether or not to have children. Therefore, pro-natalist policies may increase the fertility rate for all groups, but have an especially beneficial effect on Asians and whites.


