Race Gaps in SAT Scores Highlight Inequality and Hinder Upward Mobility
Richard V. Reeves and Dimitrios Halikias, Brookings, February 1, 2017
Taking the SAT is an American rite of passage. Along with the increasingly popular ACT, the SAT is critical in identifying student readiness for college and as an important gateway to higher education. Yet despite efforts to equalize academic opportunity, large racial gaps in SAT scores persist.
The SAT provides a measure of academic inequality at the end of secondary schooling. Moreover, insofar as SAT scores predict student success in college, inequalities in the SAT score distribution reflect and reinforce racial inequalities across generations.
In this paper, we analyze racial differences in the math section of the general SAT test, using publicly available College Board population data for all of the nearly 1.7 million college-bound seniors in 2015 who took the SAT. (We do not use the newest data released for the class of 2016, because the SAT transitioned mid-year to a new test format, and data has so far only been released for students who took the older test.) Our analysis uses both the College Board’s descriptive statistics for the entire test-taking class, as well as percentile ranks by gender and race. (The College Board has separate categories for “Mexican or Mexican American” and “Other Hispanic, Latino, or Latin American.” We have combined them under the term Latino.)
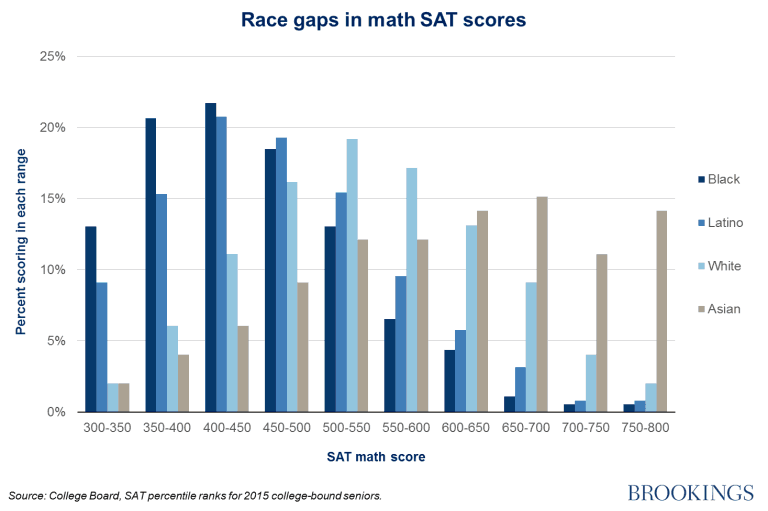
The mean score on the math section of the SAT for all test-takers is 511 out of 800, the average scores for blacks (428) and Latinos (457) are significantly below those of whites (534) and Asians (598). The scores of black and Latino students are clustered towards the bottom of the distribution, while white scores are relatively normally distributed, and Asians are clustered at the top:
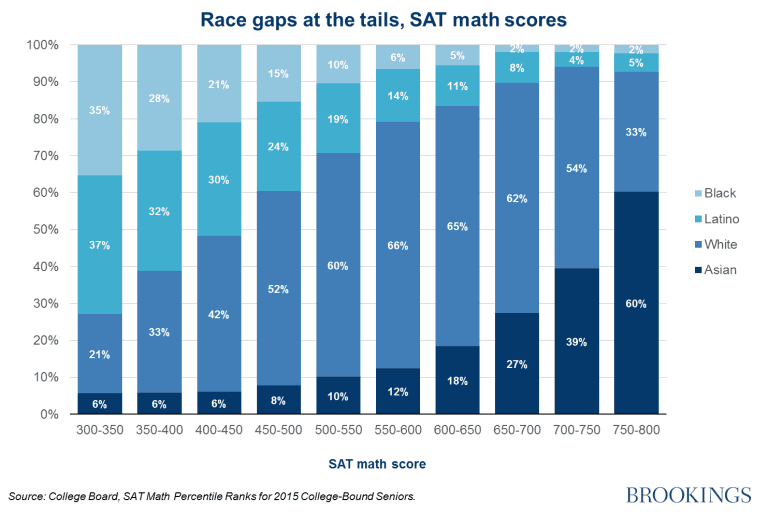
Race gaps on the SATs are especially pronounced at the tails of the distribution. In a perfectly equal distribution, the racial breakdown of scores at every point in the distribution would mirror the composition of test-takers as whole i.e. 51 percent white, 21 percent Latino, 14 percent black, and 14 percent Asian. But in fact, among top scorers — those scoring between a 750 and 800 — 60 percent are Asian and 33 percent are white, compared to 5 percent Latino and 2 percent black. Meanwhile, among those scoring between 300 and 350, 37 percent are Latino, 35 percent are black, 21 percent are white, and 6 percent are Asian:
The College Board’s publicly available data provides data on racial composition at 50-point score intervals. We estimate that in the entire country last year at most 2,200 black and 4,900 Latino test-takers scored above a 700. In comparison, roughly 48,000 whites and 52,800 Asians scored that high. The same absolute disparity persists among the highest scorers: 16,000 whites and 29,570 Asians scored above a 750, compared to only at most 1,000 blacks and 2,400 Latinos. (These estimates — which rely on conservative assumptions that maximize the number of high-scoring black students, are consistent with an older estimate from a 2005 paper in the Journal of Blacks in Higher Education, which found that only 244 black students scored above a 750 on the math section of the SAT.)
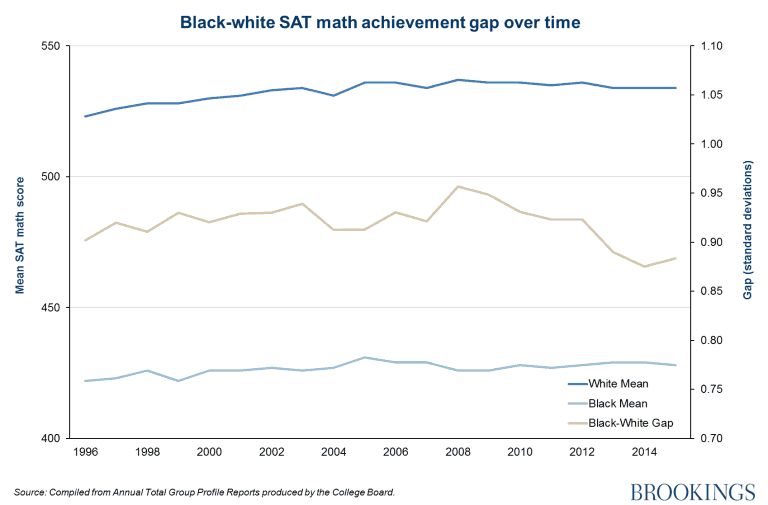
Disappointingly, the black-white achievement gap in SAT math scores has remained virtually unchanged over the last fifteen years. Between 1996 and 2015, the average gap between the mean black score and the mean white score has been .92 standard deviations. In 1996 it was .9 standard deviations and in 2015 it was .88 standard deviations. This means that over the last fifteen years, roughly 64 percent of all test-takers scored between the average black and average white score.
These gaps have a significant impact on life chances, and therefore on the transmission of inequality across generations. As the economist Bhashkar Mazumder has documented, adolescent cognitive outcomes (in this case, measured by the AFQT) statistically account for most of the race gap in intergenerational social mobility.
There are some limitations to the data which may mean that, if anything, the race gap is being understated. The ceiling on the SAT score may, for example, understate Asian achievement. If the exam was redesigned to increase score variance (add harder and easier questions than it currently has), the achievement gap across racial groups could be even more pronounced. In other words, if the math section was scored between 0 and 1000, we might see more complete tails on both the right and the left. More Asians score between 750 and 800 than score between 700 and 750, suggesting that many Asians could be scoring above 800 if the test allowed them to.
{snip}


