A Revealing Map of the World’s Most and Least Ethnically Diverse Countries
Max Fisher, Washington Post, May 16, 2013
{snip}
When five economists and social scientists set out to measure ethnic diversity for a landmark 2002 paper for the Harvard Institute of Economic Research, they started by comparing data from an array of different sources: national censuses, Encyclopedia Brittanica, the CIA, Minority Rights Group International and a 1998 study called “Ethnic Groups Worldwide.” They looked for consistence and inconsistence in the reports to determine what data set would be most reliable and complete. Because data sources such as censuses or surveys are self-reported – in other words, people are classified how they ask to be classified – the ethnic group data reflects how people see themselves, not how they’re categorized by outsiders. Those results measured 650 ethnic groups in 190 countries.
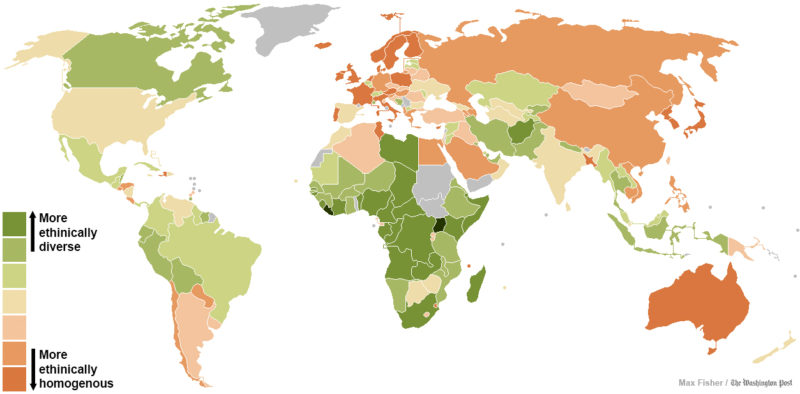
One thing the Harvard Institute authors did with all that data was measure it for what they call ethnic fractionalization. Another word for it might be diversity. They gauged this by asking an elegantly simple question: If you called up two people at random in a particular country and ask them their ethnicity, what are the odds that they would give different answers? The higher the odds, the more ethnically “fractionalized” or diverse the country.
I’ve mapped out the results above. The greener countries are more ethnically diverse and the orange countries more homogenous. There are a few trends you can see right away: countries in Europe and Northeast Asia tend to be the most homogenous, sub-Saharan African nations the most diverse. The Americas are generally somewhere in the middle. And richer countries appear more likely to be homogenous.
{snip}
Before we go any further, though, a few important caveats, all of which appear in the original research paper as well. Well, all except for the report’s age. It’s now 11 years old. And given the scarcity of information from some countries, some of the data are very old, dating from as far back as the early 1990s or even late 1980s. {snip}
Another caveat is that people in different countries might have different bars for what constitutes a distinct ethnicity. These data, then, could be said to measure the perception of ethnic diversity more than the diversity itself; given that ethnicity is a social construct, though those two metrics are not necessarily as distinct as one might think. Finally, as the paper notes, “It would be wrong to interpret our ethnicity variable as reflecting racial characteristics alone.” Ethnicity might partially coincide with race, but they’re not the same thing.
Now for the data itself. Here are a few observations and conclusions, a number of which draw from the Harvard Institute paper:
{snip}
• Diversity and conflict. Internal conflicts appear on first blush to be more common in greener countries, which might make some intuitive sense given that groups with comparable “stakes” in their country’s economics and politics might be more willing or able to compete, perhaps violently, over those resources. But there’s enough data here to draw a lot of different conclusions. One thing to keep in mind is that ethnicity might not be static or predetermined. In other words, as in the case of Somalia, maybe worsening economic conditions or war make people more likely to further divide along ethnic fractions.
• Diversity correlates with latitude and low GDP per capita. The report notes, “our measures of linguistic and ethnic fractionalization are highly correlated with latitude and GDP per capita. Therefore it is quite difficult to disentangle the effect of these three variables on the quality of government.” As above, keep in mind that correlation and causation aren’t the same thing.
• Strong democracy correlates with ethnic homogeneity. This does not mean that one necessarily causes the other; the correlation might be caused by some other factor or factors. But here’s the paper’s suggestion for why diversity might make democracy tougher in some cases:
The democracy index is inversely related to ethnic fractionalization (when latitude is not controlled for). This result is consistent with theory and evidence presented in Aghion, Alesina and Trebbi (2002). The idea is that in more fragmented societies a group imposes restrictions on political liberty to impose control on the other groups. In more homogeneous societies, it is easier to rule more democratically since conflicts are less intense.
{snip}


