A Record Increase in Murder in 2020
Chris Roberts, American Renaissance, January 22, 2020
Credit Image: © TNS via ZUMA Wire
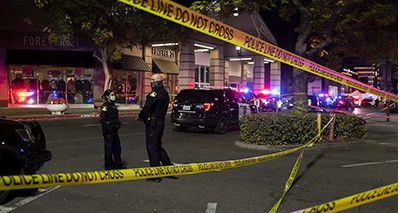
In 2020, major media covered COVID-19, the election, and “systemic racism” heavily, but mostly ignored the rise in crime.
The increase was not minor. Homicide numbers for 2020 are now available for most cities, and the data reveal a single-year change unlike any other in US history. Until now, the largest one-year increase in the United States was in 1968, when there were 12.7 percent more homicides than in the previous year. The change from 2019 to 2020 will be greater.
Steve Sailer has calculated that in the largest US cities, the increase was 38.5 percent. Data from rural areas, not yet available, will almost certainly lower the national average, but not to less than 12.7 percent. Eleven major cities set new records for most homicides in a single year: Columbus, Charlotte, Indianapolis, Memphis, Louisville, Milwaukee, Kansas City, Colorado Springs, Cincinnati, Toledo, Wichita, and Jackson.
Usually, spikes in crime elicit law-and-order proposals from politicians and tougher enforcement from police — as in the late 1960s and the early 1990s. The opposite happened last year, especially after George Floyd’s death in May. During the subsequent riots, New York City Attorney General Cyrus Vance announced his office would not prosecute “low-level” offenses by rioters, letting hundreds out of jail. In Dallas, police arrested 647 demonstrators for blocking a highway, but the police chief dropped all charges. When the riots reached St. Louis, police arrested 36 people, but the city government promptly let them go. Much the same happened in Washington, DC and Philadelphia.

July 6, 2020, New York, New York: Assistant Chief Jason Wilcox holds flyer offering award for information leading to arrest of killer of Anthony Robinson. (Credit Image: © Lev Radin/Pacific Press via ZUMA Wire)
Since at least 2018, George Soros and his network have spent over $100 million to elect prosecutors who favor catch-and-release policing. The most powerful are St. Louis Circuit Attorney Kim Gardner, Illinois State Attorney Kim Foxx, Philadelphia District Attorney Larry Krasner, San Francisco District Attorney Chesa Boudin, Multnomah County (Portland, Oregon) District Attorney Mike Schmidt, and Los Angeles District Attorney George Gascón. Every jurisdiction in which these progressives hold power saw a rise in violent crime.
Many major cities no longer prosecute minor offenses such as loitering and fare evasion. This lets common criminals stay out of jail and creates an atmosphere of lawlessness. Letting most arrested nonviolent criminals back on the streets without paying bail has the same effect. New York City adopted bail reform at the start of 2020, well before the summer’s riots, and crime increased swiftly.

January 31, 2020, New York City: Hundreds march through the streets of Manhattan and Grand Central Terminal to protest against recent arrests by the NYPD. (Credit Image: © John Lamparski/SOPA Images via ZUMA Wire)
Cutting police budgets was the fashion in 2020: Austin cut $150 million; Seattle cut $3.5 million and added $17 million for community outreach; New York City cut $1 billion; Los Angeles cut $150 million; San Francisco cut $120 million; Oakland cut $14.6 million; Washington, DC, cut $15 million; Baltimore cut $22 million; Portland cut $16 million; and Philadelphia cut $33 million. Many smaller cities made similar cuts.
In the second half of 2020, corporations gave billions of dollars to Black Lives Matter and similar groups, and celebrities and politicians raised money to bail looters and rioters out of prison. With open cultural, political, and financial support — and few consequences for breaking the law — lawbreakers are likely to feel untouchable; 2021 could be even deadlier than 2020.
Below are homicide data for 47 US cities. They come from news stories, police reports, and City-Data. The numbers for 2020 are subject to revision.
| New York City | |||
|---|---|---|---|
| 2019 | 2020 | Increase | Most recent year with more homicides |
| 318 | 462 | 45.3% | 2011, with 515 |
| Los Angeles | |||
|---|---|---|---|
| 2019 | 2020 | Increase | Most recent year with more homicides |
| 258 | 349 | 35.3% | 2008, with 384 |
| Chicago | |||
|---|---|---|---|
| 2019 | 2020 | Increase | Most recent year with more homicides |
| 492 | 769 | 56.3% | 2016, with 784 |
Note: In 2019, about 80.7 percent of homicide victims in the Windy City were black. In 2020, about 79.2 percent were, so black deaths accounted for almost the entire increase of 56.3 percent.
| Houston | |||
|---|---|---|---|
| 2019 | 2020 | Increase | Most recent year with more homicides |
| 281 | 400 | 42.4% | 1993, with 447 |
| Phoenix | |||
|---|---|---|---|
| 2019 | 2020 | Increase | Most recent year with more homicides |
| 123 | 187 | 52.0% | 2007, with 213 |
| Philadelphia | |||
|---|---|---|---|
| 2019 | 2020 | Increase | Most recent year with more homicides |
| 356 | 499 | 40.2% | 1990, with 504 |
| San Antonio | |||
|---|---|---|---|
| 2019 | 2020 | Increase | Most recent year with more homicides |
| 105 | 124 | 18.1% | 2017, with 125 |
| Dallas | |||
|---|---|---|---|
| 2019 | 2020 | Increase | Most recent year with more homicides |
| 210 | 251 | 19.5% | 1998, with 252 |
| San Jose | |||
|---|---|---|---|
| 2019 | 2020 | Increase | Most recent year with more homicides |
| 34 | 44* | 29.4% | 2016, with 47 |
*The story linked to reports 43 homicides for 2020, but there was one more on December 31.
| Austin | |||
|---|---|---|---|
| 2019 | 2020 | Increase | Most recent year with more homicides |
| 32 | 47 | 46.9% | N/A |
| Jacksonville, FL | |||
|---|---|---|---|
| 2019 | 2020 | Increase | Most recent year with more homicides |
| 162 | 176 | 8.6% | 187 in 1988 |
| Fort Worth | |||
|---|---|---|---|
| 2019 | 2020 | Increase | Most recent year with more homicides |
| 71 | 112 | 57.8% | Media reported 2020’s number as the highest in “25 years.” |
| Columbus | |||
|---|---|---|---|
| 2019 | 2020 | Increase | Most recent year with more homicides |
| 104 | 174 | 67.3% | New record |
| Charlotte, NC | |||
|---|---|---|---|
| 2019 | 2020 | Increase | Most recent year with more homicides |
| 107 | 123 | 14.9% | New record |
| San Francisco | |||
|---|---|---|---|
| 2019 | 2020 | Increase | Most recent year with more homicides |
| 41 | 47 | 14.6% | 2017, with 56 |
| Indianapolis | |||
|---|---|---|---|
| 2019 | 2020 | Increase | Most recent year with more homicides |
| 172 | 244 | 41.9% | New record |
| Seattle | |||
|---|---|---|---|
| 2019 | 2020 | Increase | Most recent year with more homicides |
| 35 | 52 | 48.6% | 1994, with 69 |
| Denver | |||
|---|---|---|---|
| 2019 | 2020 | Increase | Most recent year with more homicides |
| 63 | 94 | 49.2% | The highest since 1985. (Earlier years are unavailable.) |
| Washington, DC | |||
|---|---|---|---|
| 2019 | 2020 | Increase | Most recent year with more homicides |
| 166 | 198 | 19.3% | 2004, with 248 |
| Boston | |||
|---|---|---|---|
| 2019 | 2020 | Increase | Most recent year with more homicides |
| 37 | 57 | 54.1% | 2011, with 63 |
| Nashville | |||
|---|---|---|---|
| 2019 | 2020 | Increase | Most recent year with more homicides |
| 84 | 109 | 29.8% | 2017, with 110 |
| Detroit | |||
|---|---|---|---|
| 2019 | 2020 | Increase | Most recent year with more homicides |
| 274 | 327 | 19.3% | 2013, with 332 |
| Portland, OR | |||
|---|---|---|---|
| 2019 | 2020 | Increase | Most recent year with as many homicides |
| 35 | 55 | 57.1% | 1994, with 55 |
| Las Vegas | |||
|---|---|---|---|
| 2019 | 2020 | Increase | Most recent year with more homicides |
| 109 | 151 | 38.5% | 2017, with 205 |
| Memphis | |||
|---|---|---|---|
| 2019 | 2020 | Increase | Most recent year with more homicides |
| 191 | 332 | 73.8% | New record |
| Louisville | |||
|---|---|---|---|
| 2019 | 2020 | Increase | Most recent year with more homicides |
| 89 | 173 | 94.4% | New record |
| Milwaukee | |||
|---|---|---|---|
| 2019 | 2020 | Increase | Most recent year with more homicides |
| 97 | 189 | 94.8% | New record |
| Fresno | |||
|---|---|---|---|
| 2019 | 2020 | Increase | Most recent year with more homicides |
| 45 | 72 | 60.0% | 1994, with 87 |
| Sacramento | |||
|---|---|---|---|
| 2019 | 2020 | Increase | Most recent year with more homicides |
| 34 | 41 | 20.6% | 2015, with 43 |
| Atlanta | |||
|---|---|---|---|
| 2019 | 2020 | Increase | Most recent year with more homicides |
| 99 | 154 | 55.6% | 1990, with 241 |
| Kansas City, KS | |||
|---|---|---|---|
| 2019 | 2020 | Increase | Most recent year with more homicides |
| 150 | 182 | 21.3% | New record |
| Colorado Springs | |||
|---|---|---|---|
| 2019 | 2020 | Increase | Most recent year with more homicides |
| 24 | 36 | 50.0% | New record |
| Omaha | |||
|---|---|---|---|
| 2019 | 2020 | Increase | Most recent year with more homicides |
| 23 | 37 | 60.9% | 2015, with 48 |
| Oakland | |||
|---|---|---|---|
| 2019 | 2020 | Increase | Most recent year with more homicides |
| 78 | 109 | 39.7% | 2012, with 127 |
| Minneapolis | |||
|---|---|---|---|
| 2019 | 2020 | Increase | Most recent year with more homicides |
| 48 | 82 | 70.8% | The mid-1990s |
| Wichita | |||
|---|---|---|---|
| 2019 | 2020 | Increase | Most recent year with more homicides |
| 44 | 59 | 27.3% | New record |
| Cleveland | |||
|---|---|---|---|
| 2019 | 2020 | Increase | Most recent year with more homicides |
| 133 | 185 | 39.1% | 1982, with 195 |
| St. Paul | |||
|---|---|---|---|
| 2019 | 2020 | Increase | Most recent year with as many homicides |
| 30 | 34 | 13.3% | 1992, with 34 |
| Cincinnati | |||
|---|---|---|---|
| 2019 | 2020 | Increase | Most recent year with more homicides |
| 73 | 92 | 26.0% | New record |
| St. Louis | |||
|---|---|---|---|
| 2019 | 2020 | Increase | Most recent year with more homicides |
| 194 | 262 | 35.1% | 1993 with 267 |
| Toledo, OH | |||
|---|---|---|---|
| 2019 | 2020 | Increase | Most recent year with more homicides |
| 38 | 61 | 60.5% | New record |
| Birmingham | |||
|---|---|---|---|
| 2019 | 2020 | Increase | Most recent year with more homicides |
| 106 | 122 | 15.1% | 1994, with 135 |
| Jackson, MS | |||
|---|---|---|---|
| 2019 | 2020 | Increase | Most recent year with more homicides |
| 82 | 128 | 56.1% | New record |
| Savannah | |||
|---|---|---|---|
| 2019 | 2020 | Increase | Most recent year with more homicides |
| 23 | 32 | 39.1% | N/A |
| Bridgeport | |||
|---|---|---|---|
| 2019 | 2020 | Increase | Most recent year with more homicides |
| 17 | 24 | 41.2% | 2006, with 28 |
| New Haven | |||
|---|---|---|---|
| 2019 | 2020 | Increase | Most recent year with more homicides |
| 12 | 20 | 66.66% | 2011, with 34 |
| Flint | |||
|---|---|---|---|
| 2019 | 2020 | Increase | Most recent year with more homicides |
| 43 | 60 | 39.5% | 2012, with 63 |
In these cities, homicide increased by 41.1 percent, from 5,342 in 2019 to 7,537 in 2020.


