Birth Rates: Who is Winning the Race?
Anthony Brown, American Renaissance, November 2000
The demographics of the future depend on the birth rates of today. Who is having children in America? In March the government released complete statistics on the 3,941,553 births registered in 1998. We also have preliminary figures for 1999, but they indicate little change since 1998.
Since 1980, the government has recognized four races: white, black, American Indian, and Asian/ Pacific Islander. In 1989, the government began distinguishing ethnicity: Hispanic and non-Hispanic, both of which “can be of any race.” The vast majority of Hispanics are classified as “white,” so reports often provide data for “non-Hispanic whites,” which include North Africans, Middle Easterners, and (in most states) people from the Indian subcontinent. In the statistics that follow, “white” includes all these people in addition to Europeans but does not include Hispanics.
To summarize the 1998 birth statistics: 1) non-whites are out-breeding whites by a considerable margin, and 2) as a nation, we have an increasingly careless attitude towards childbearing, as shown by unprecedented levels of illegitimacy and teenage births.
Family Values?
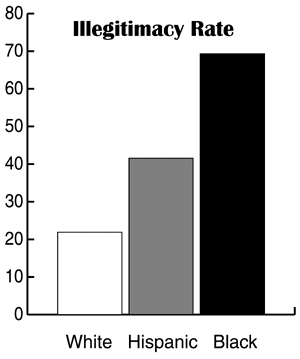
In 1998, 1,293,567 births — nearly one in three — were to unmarried women. The graph on the left shows blacks had the highest illegitimacy rate, an astonishing 69.3 percent. The government report also tells us that 90.1 of every 1,000 unmarried Hispanic women — nearly one in ten — had a child. This was the lowest rate reported since 1990, but was still more than three times the white rate. Seven percent of unmarried black women had children.
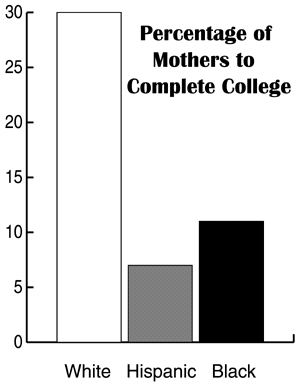
Twenty-two percent of the women who gave birth in 1998 had not finished high school and only 23 percent were college graduates. Forty-nine percent of the 700,000 Hispanic women who gave birth in 1998 hadn’t finished high school, compared to 13 percent for whites. The median educational level for all mothers was 12.9 years. The graph below shows the percentage of college-educated mothers in each race.
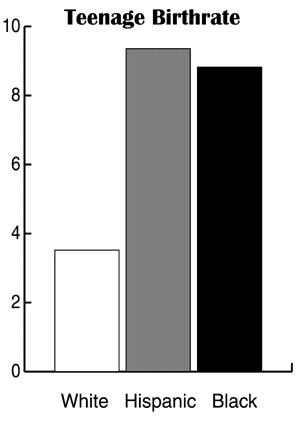
Five percent of all American teenagers gave birth in 1998. The next graph shows the white teenage birthrate was lowest, at 3.52 percent. Nearly one in ten Hispanic girls aged 15-19 had babies in 1998.
Despite this high teenage pregnancy rate, the median age for a mother’s first child has increased from 22.0 years in 1972 to 24.2 years. Whites in particular, are paralleling a European trend; as women enter the work force, they wait longer to have children, and have fewer children. Because non-whites start having children at a younger age than whites, they have shorter generations, which is an added factor in population differentials.
The Health of Infants
Premature birth and low birth weight (LBW) suggest the likelihood of medical problems in infants. In 1998, 17.6 percent of black babies completed fewer than 37 weeks of gestation, compared with 11.4 percent of Hispanics and 10.2 percent of whites. These figures do not take into account the fact that blacks have a slighter shorter gestation period that whites.
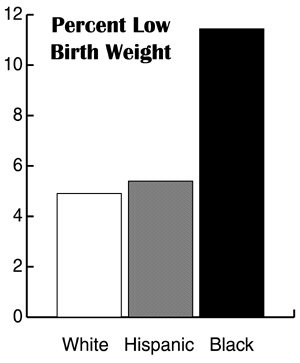
In 1998, 7.6 percent of all babies were born weighing less than 5.5 pounds, which is considered a dangerously low weight. The graph below shows LBW by race. The median birth weight for “white” babies, including Hispanics, is 7 lb, 8 oz; for black babies, it is 7 lb, 1 oz.
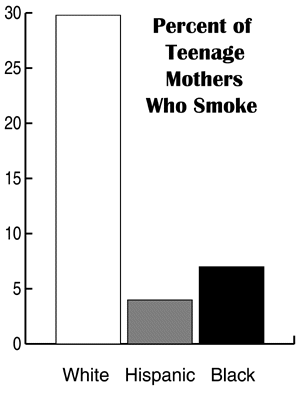
Babies are more likely to have LBW when their mothers smoke, and the graph above shows that this is overwhelmingly a white problem. Twelve percent of the babies of mothers who smoke have low birth weight, as opposed to only 7.2 percent of babies whose mothers do not smoke. White babies have the lowest LBW rates despite the large number of smokers smoke. If white mothers stopped smoking, the racial differences would be even greater.
Of roughly four million births in 1998, 2,361,462 babies were to whites, 593,127 to blacks, and 734,661 to Hispanics. For now, whites are having more children than the black and Hispanic populations combined. However, the 70 percent of the population that is white is producing only 60 percent of the next generation, and both those figures are declining.
As of 1998, the total fertility rate — the number of children the average American woman will have during her life — was 2.06. Because more boys than girls are born, and because some number of children do not survive to reproductive age, the total fertility rate must reach 2.1 for a population to sustain its numbers. The US rate has been below “replacement level” since 1971, when it was 2.27. Our population grows despite this because of immigration.
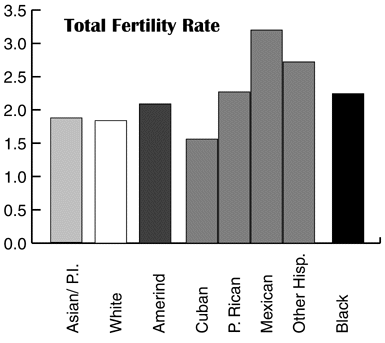
The large graph below shows total fertility rates for different American groups. For whites, the 1998 level was 1.84, well below replacement level. The Asian rate is only slightly higher. Interestingly, Hispanics of different origins have widely varying total fertility rates, with the Cuban rate even lower than the white rate.
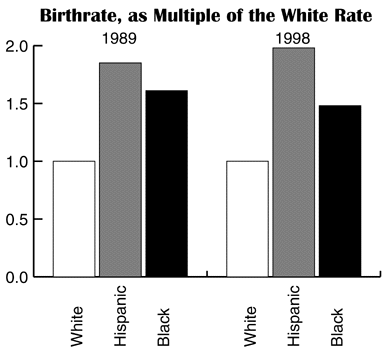
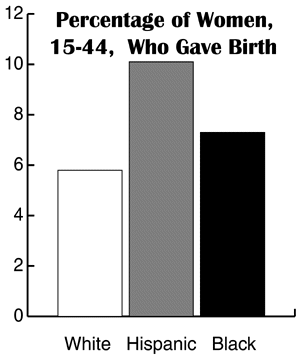
Changes in fertility rates have dramatic consequences. In 1998, 150,000 fewer white American babies came into the world than in 1989. From 1990 to 1997 the white birth rate (defined as the percentage of women who gave birth) declined 9 percent, continuing a trend that dates back to the mid-1950s. In 1955, whites had 113.7 births per 1,000 females aged 15-44, slightly higher than the present Mexican-American birth rate. Today, the birth rates of Amerinds, Asians/ Pacific Islanders, and whites are all below replacement level. However, in 1998 as well as in years past, the rate has been well above replacement for Hispanics and blacks. The graph below shows birthrates for America’s three main racial groups.
According to May, 2000, census estimates — generally thought to be accurate — the white population (including Arabs, Middle-Easterners, etc.) is now 71.4 percent, followed by blacks at 12.2 percent, Hispanics at 11.7 percent, Asians at 4.1 percent, and Amerinds at 0.6 percent. The median ages of these racial groups tells an important story. For whites the median age is 38.4 years; for Asians 32.3 years, blacks 30.5 years, Amerinds 28.4 years, and 26.6 years for Hispanics. Since the white population is relatively old and producing relatively few babies, it is aging rapidly.
Because of immigration and birthrate differentials, the U.S. Census Bureau projects that with middle-level immigration whites will be a minority in this country by the year 2060, not even a century after President Johnson opened the doors to non-white immigration. At that time, in 1965, the country was close to 90 percent white. Although this projection distinguishes whites from Hispanics, it still includes Arabs, Middle-Easterners, Indians, Pakistanis, Sri Lankans, and other non-Europeans.