Comparing Mexico’s Remittances to Every Other Country
Howmuch, February 11, 2018
President Trump has long threatened to impose a tax on remittances to Mexico to pay for a wall along the U.S.-Mexico border. {snip}
Our map was inspired by the Pew Research Center, which gathered data from economists at the World Bank. The numbers reflect cash flows in 2016 leaving the U.S. to people in other countries through official channels, like a bank or wire transfer service. The data exclude cash flows through informal networks — think of sending cash through the mail — which economists suspect might add up to 50% to these totals. {snip}
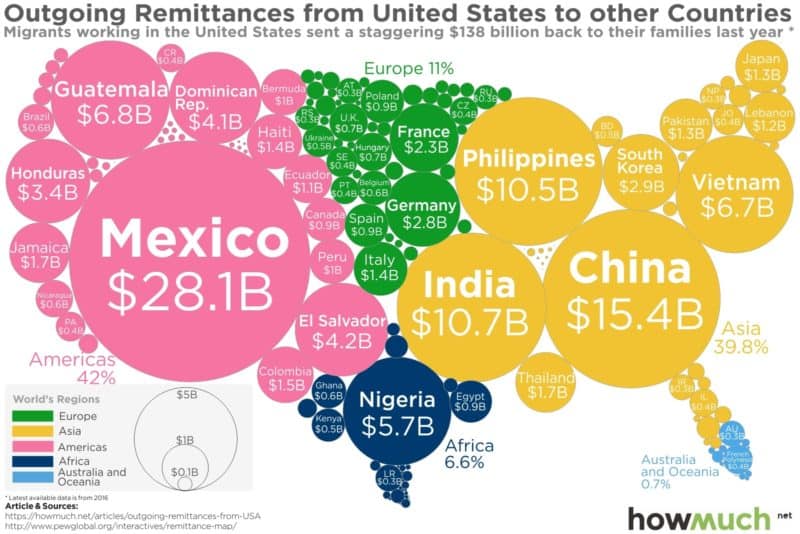
First off, the Americas and Asia receive the majority of remittance payments, accounting for 42% and 39.8% of the total global cash flow, respectively. Europe, Africa and Australia and Oceana receive very little money in comparison. Mexico ($28.1B), China ($15.4B), India ($10.7B) and the Philippines ($10.5B) immediately stand out as the top four countries, making up a combined $64.7B in annual remittances, or almost half the entire market (47%, combined).
{snip} Mexico is the obvious stand out in the Americas, but that’s probably because of its physical proximity to the U.S. Instead, take a look at the Dominican Republic ($4.1B). Combined with Haiti ($1.4B), this one island would crack the top ten destinations for cash leaving the U.S. But just how big is the market for remittances to Mexico (at $28.1B)? It’s at an all-time high right now, and represents the equivalent of the entire economy of Paraguay. {snip}
{snip}
Top 10 Destinations for Remittances from the United States
1. Mexico: $28.1B
2. China: $15.4B
3. India: $10.7B
4. Philippines: $10.5B
5. Guatemala: $6.8B
6. Vietnam: $6.7B
7. Nigeria: $5.7B
8. El Salvador: $4.2B
9. Dominican Republic: $4.1B
10. Honduras: $3.4B
We can summarize our map of remittances like this: when it rains, it pours. {snip}
Click on the image to see an enlargement.