Voting Rate for the Non-Hispanic Black Population Dropped in the 2016 Presidential Election
US Census, May 10, 2017
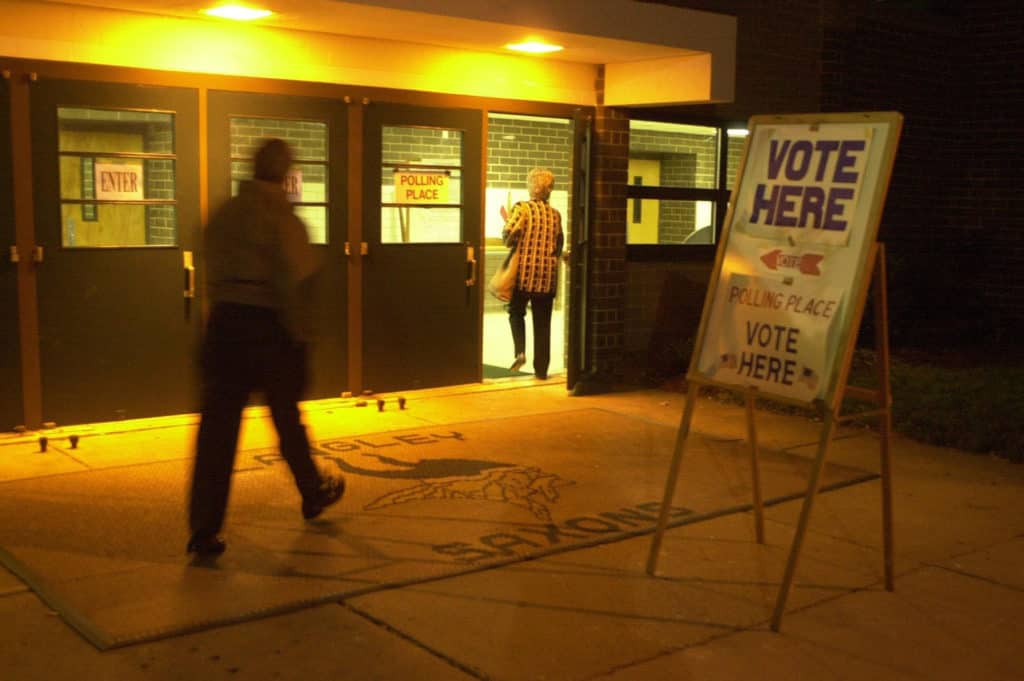
Credit Image: The Washington Times/ZUMAPRESS.com
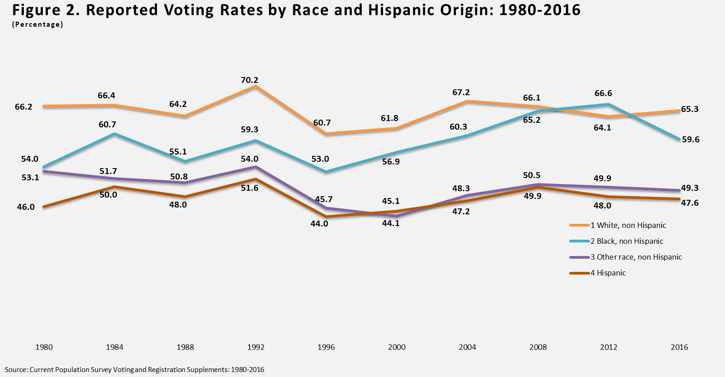
According to new U.S. Census Bureau data, voter turnout increased to 65.3 percent for non-Hispanic whites, but decreased to 59.6 percent for non-Hispanic blacks in the 2016 presidential election (Figure 2). This compared to 2012, when more non-Hispanic blacks (66.6 percent) voted than non-Hispanic whites (64.1 percent) for the first time in this series.
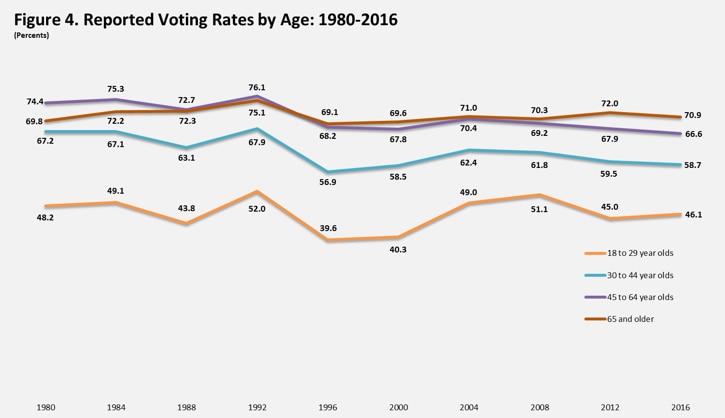
In addition, voters ages 18 to 29 were the only age group to show increased turnout between 2012 (45 percent) and 2016 (46.1 percent), an increase of 1.1 percent (Figure 4). All older age groups either reported small, yet statistically significant turnout decreases or turnout rates not statistically different from 2012.
These data come from the Voting and Registration Supplement to the Current Population Survey for the November 2016 election, which surveys the civilian noninstitutionalized population in the United States.
This table package provides data with a focus on patterns of voter turnout by race, Hispanic origin, age and other demographic characteristics such as educational attainment and family income. By examining these characteristics and how they have changed over the years, these statistics provide a better understanding of the social and demographic factors that have influenced recent American elections.
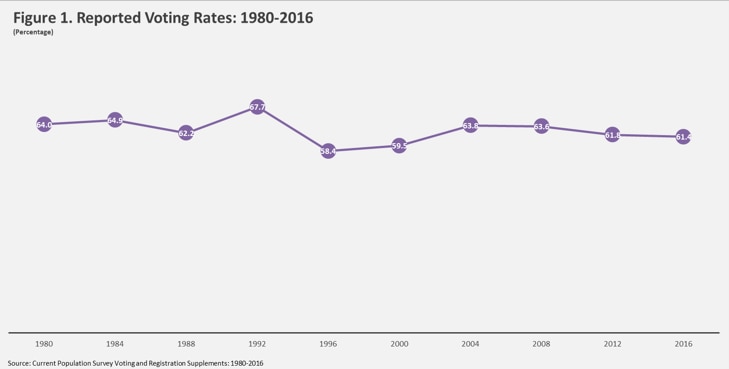
- In 2016, 61.4 percent of the citizen voting-age population reported voting, a number not statistically different from the 61.8 percent who reported voting in 2012 (Figure 1).
- For only the second time since 1980, the percentage of voters in 2016 who were non-Hispanic white (73.3 percent) was not lower than in the previous presidential election (Figure 3). Additionally, 2016 was only the second election in this series where the share of voters who were non-Hispanic black did not increase, but actually decreased, from 12.9 percent in 2012 to 11.9 percent in 2016.
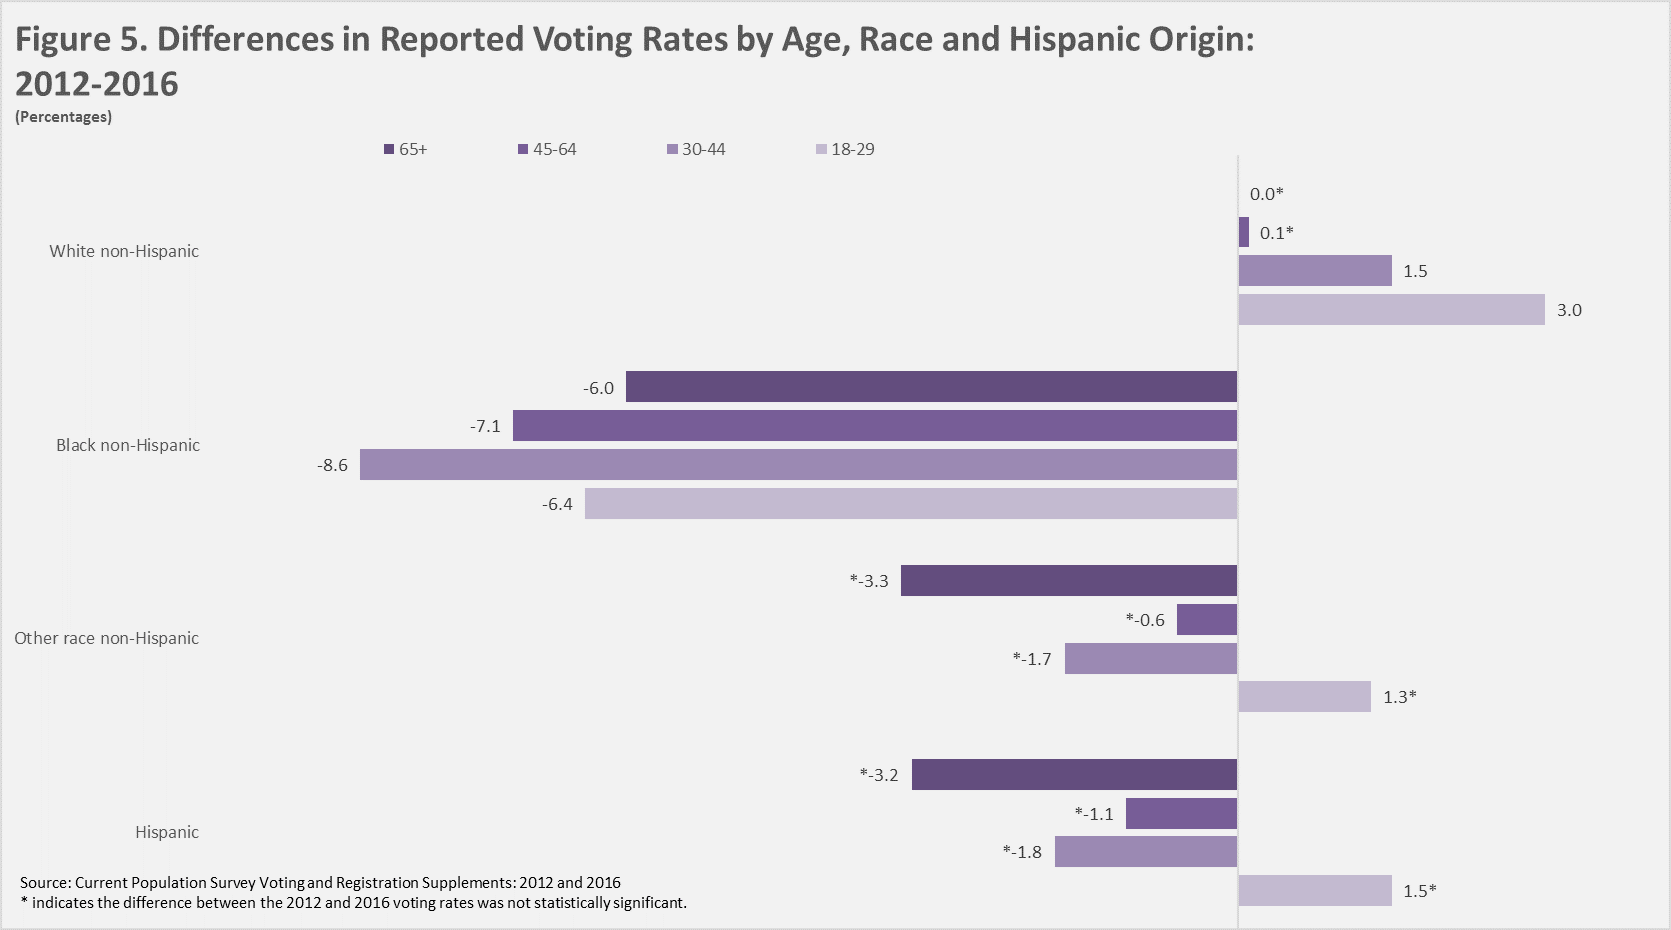
- When analyzed together, reported turnout by age, race and Hispanic-origin differed in 2016 as well. In comparison to 2012, younger non-Hispanic whites between the ages of 18 to 29 and between the ages of 30 to 44 reported higher turnout in 2016 (Figure 5). Meanwhile, for non-Hispanic blacks, turnout rates decreased in 2016 for every age group. For other race non-Hispanics and Hispanics of any race, voting rates between 2012 and 2016 were not statistically different for any age groups.
The Census Bureau has collected voting and registration data since 1964 and has fielded the Voting and Registration Supplement to the Current Population Survey every 2 years. This survey is the most comprehensive data source available on the social and demographic composition of the electorate in federal elections. The estimates presented in this table package may differ from those based on administrative data or exit polls due to factors such as survey nonresponse, vote misreporting and methodological issues related to question wording and survey administration.
For data from previous election years, visit the Voting and Registration page.


