These Maps Show the Geography of Interracial Marriage
Andy Kiersz, Business Insider, February 7, 2014
Attitudes towards interracial marriage in the United States have changed over time. Marriages between people of different races are becoming more common — in 2000, 7.4% of all marriages were between spouses of different races, whereas in 2010, that figure rose to 9.5%.
Researchers at the U.S. Census bureau made a fascinating series of maps to analyze the geography of interracial marriages. (via Matthew Klein)
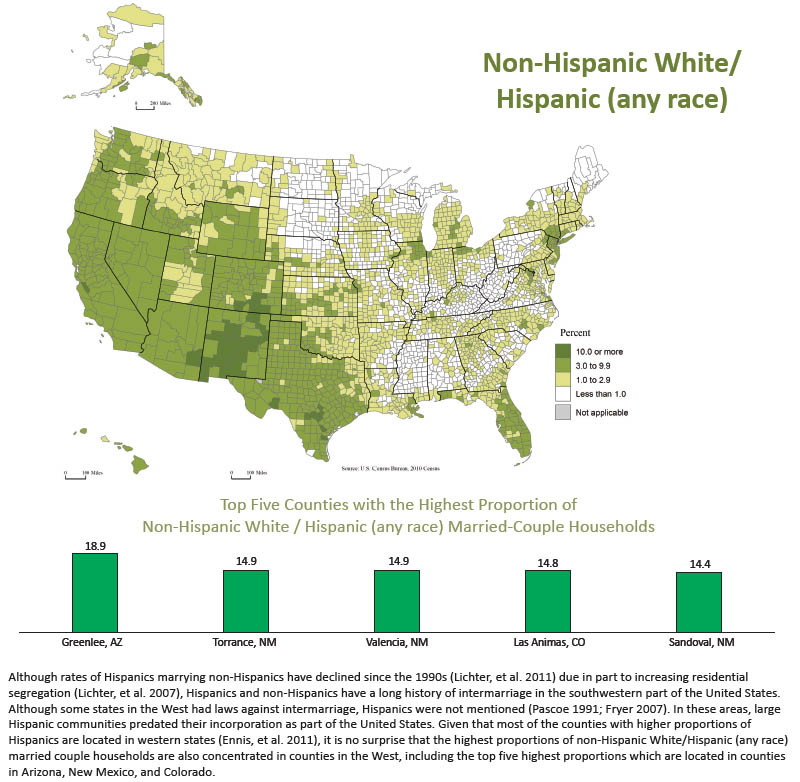
Non-Hispanic White/Hispanic marriages are the most common type of interracial marriage in the United States, accounting for over a third of all interracial marriages:
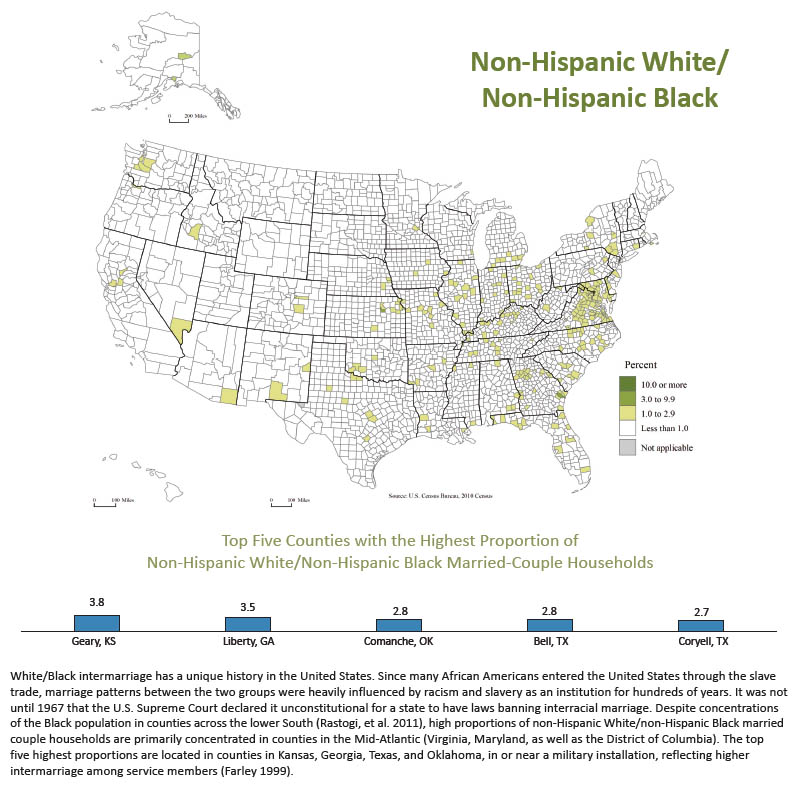
White/Black marriages are scattered throughout the country, and forty seven years after the Supreme Court struck down laws against them, they are still fairly uncommon:
{snip}
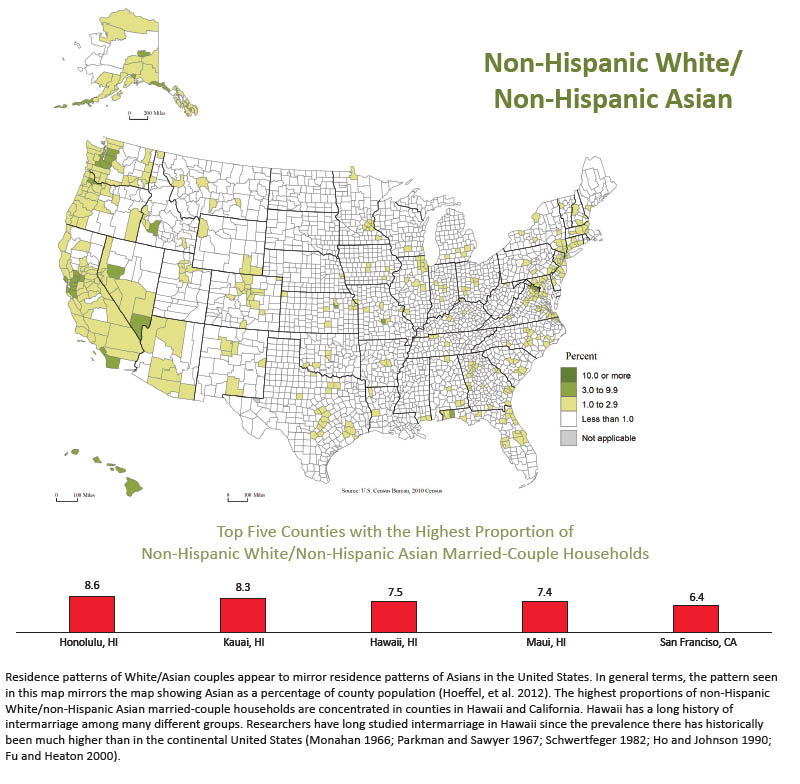
As with marriages between Whites and American Indians, White/Asian marriages largely track Asian populations:
{snip}

