Why Don’t People Vote?
Gwen Sharp, The Society Pages, November 5, 2012
Last week I posted about voter turnout patterns. In 2008, about 64% of eligible citizens voted. So what reasons do non-voters give for not taking part in the election? The Census Bureau asked. I created a chart of the data found on p. 14 of the report by Thom File and Sarah Crissey.
UPDATE: Please note this data is for registered non-voters; about 89% of this group votes, significantly higher than that for eligible citizens overall. I apologize that I didn’t make the distinction clearer in my initial post.
Here are the reasons registered non-voters gave:
{snip}
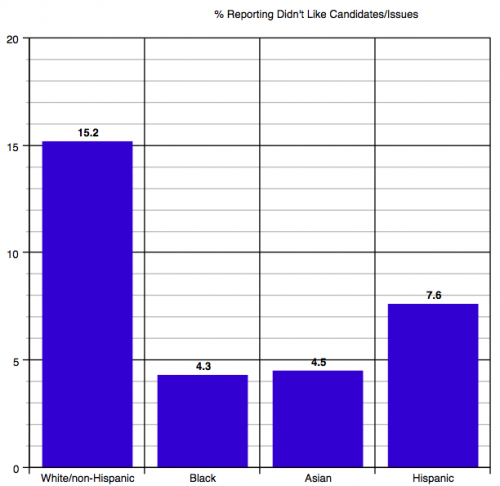
These issues were not equally problematic for all racial/ethnic groups. {snip}
White non-Hispanics were more likely than other groups to say they didn’t vote because they didn’t like the candidates or issues:
The report also breaks responses down by age and education, so check out p. 14 if you’re interested in the patterns based on those demographics. It also includes data on why people don’t register, either — the most common being lack of interest or involvement in politics.


