Disability Rates Among Working-Age Adults Are Shaped by Race, Place, and Education
Martha Ross and Nicole Bateman, Brookings, May 15, 2018
{snip} Moreover, a recent Brookings report identified particular subgroups among the out-of-work as having disproportionately high rates of disability.
{snip}
Nine percent of adults aged 25 to 54, or 11 million Americans, reported at least one of six disabilities in 2016.[1] Some patterns by place and demographics are already well-established: disability is disproportionately concentrated in the Southeast, Midwest and Appalachian areas (the so-called “disability belt”), and people with disabilities disproportionately include people with low levels of education and incomes. But analyses at the metropolitan level are less common, and given the regional nature of labor markets, regional-level data should inform efforts to help people with disabilities.
{snip}
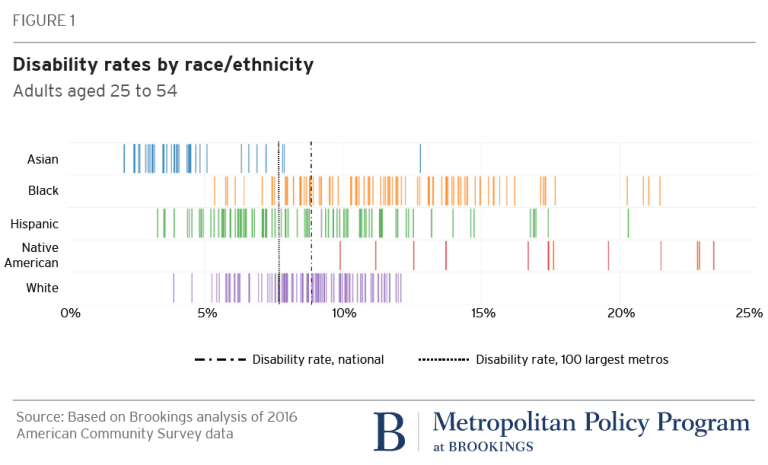
Disability by race/ethnicity varies within and between metros…
At the national level, Native Americans have the highest disability rate among working-age adults (16 percent), followed by blacks (11 percent), whites (9 percent), Hispanics (7 percent), and Asians (4 percent).
Yet disability rates by race and ethnicity also vary greatly among metro areas. As Figure 1 shows, Asians exhibit both low levels of disability and relatively small variation between places, ranging from 2 percent to 13 percent. Blacks and Hispanics both exhibit wider ranges, from the low single digits to about 20 percent. In most places, as at the national level, blacks have higher disability rates than whites, up to 2.5 times greater. In a number of metro areas, however (concentrated in Florida, North Carolina, and Connecticut), blacks have the same or lower disability rates than whites. Similarly, although Hispanics have lower disability rates than most other races/ethnicities at the national level, they are more likely to be disabled than whites and blacks in metro areas such as Spokane, Wash.; Springfield, Mass.; Deltona, Fla.; and Allentown and Pittsburgh in Pennsylvania.
…but the differences by education are much larger
{snip}
Geography also interacts with education and disability. Low education is more strongly associated with disability in some regions than others, suggesting that education is one of a number of factors that influence local disability rates. But the relationship between disability and geography is long-standing: researchers have noted it for decades, suggesting the patterns have deep roots in industrial and sociocultural conditions.
{snip}
Click on the image to see an enlargment.


