The Maps That Show How 60 Years of White Flight and Brain Drain Have Sucked the Population from the Midwest
Daily Mail (London), November 2, 2013
A new database that was built to map the inter-migration of Americans has shown how the Midwest, above all over areas, has lost the greatest amount of people since the 1950s.
With an average of 10 million Americans moving to a different county each year, researchers at the University of Wisconsin, Michigan Technological University and the University of New Hampshire have used Census statistics over the decades to track net changes in population from each county across the country.
The results graph much of what history has already told us, such as the Great Migration of blacks from the south and the white flight to northern suburbs.
However the most significant consistency is the exodus of people from the Midwest and the Great Plains, largely due to the hollowing out of the Rust Belt cities, the rise of the Sun Belt and brain drain.
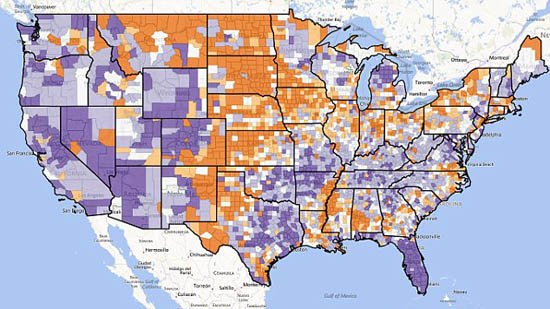
Orange represents a move of at least five people, while purple shows a net increase of 20 people per 100 individuals.
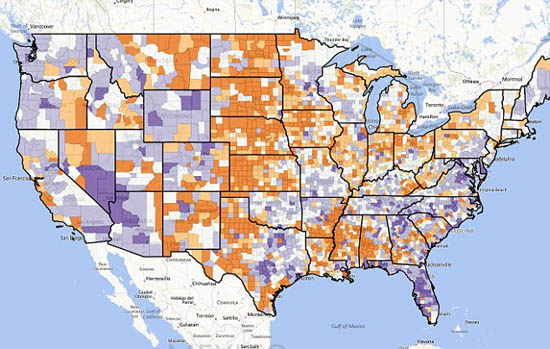
Migration during the 2000s.
The Rust Belt refers to the region that was once the hub of America’s industrial sector but faced a steep decline after much of the manufacturing was transferred to the Southeast, an increase in automation and the decline of the US steel and coal industries.
It encapsulates the areas around Pennsylvania, West Virginia, Ohio, Indiana and the Lower Peninsula of Michigan, ending in northern Illinois and eastern Wisconsin.
As the maps show, the Midwest enjoyed a boom in the 1950s and 1960s thanks to industrialization, becoming a migration mecca.

Migration during the 1950s.

Migration during the 1960s.
However as the 1970s map shows, there was a mass exodus from major Midwestern cities like Chicago, Detroit and Cleveland, as people moved to set up in the less-established surrounding counties and cities.
Migration during the 1970s.
Wayne County (Detroit) lost 26.6 percent of its white population in the 1970s. Cook County (Chicago) lost 15.5 percent, and Cuyahoga County (Cleveland) 20.1 percent, according to The Atlantic Cities.
Despite a spike in the 1990s, mostly around Chicago, that decline has been steady since, with many younger people relocating to places like San Diego, Austin and Atlanta.
The 1970’s also marked the rise of Texas and a popularity among surrounding states like Oklahoma, Arkansas and Missouri.
There was also a strong growth all over Florida.
In the 1980’s, Nevada emerged as the fastest growing US state.

Migration during the 1980s.
Despite strong competition from Atlantic City, which had introduced almost-identical gaming laws in the late seventies, Nevada continued to increase.
By 1990, it measured a population of 1.2 million, with many contributing the number to the opening of The Mirage in 1989, which at the time was the greatest casino Las Vegas, if not the world, had seen.

Migration during the 1990s.
See more maps or do your own demographic searches here.